

This week’s stock analysis is Chipotle (CMG).
Chipotle, is an American chain of 2622 fast casual restaurants in the United States, United Kingdom, Canada, Germany, and France, specializing in tacos and Mission burritos that are made to order in front of the customer. The company trades roughly 300,000 shares a day on the New York Stock Exchange under the ticker symbol CMG.
Founded by Steve Ells on July 13, 1993. Ellis had become a line cook for Jeremiah Tower at Stars in San Francisco. Ells had observed the popularity of the taquerias and San Francisco burritos in the Mission District. In 1993, Ells took what he learned in San Francisco and opened the first Chipotle Mexican Grill in Denver, Colorado, in a former Dolly Madison Ice Cream store near the University of Denver campus, using an $85,000 loan from his father.
Today the average Chipotle restaurant does $2.2 million in sales. In 2020 the company generated almost $6 billion in annual revenue.
In this weekly stock study, we will look at and analyze the following indicators and metrics which are our guidelines which dictate our behavior in deciding whether to buy, sell, or stand aside on a particular stock.
- Wall Street Analysts’ Estimates
- 52-week high and low boundaries
- Vantagepoint A.I. Forecast (Predictive Blue Line)
- Neural Network Forecast
- Daily Range Forecast
- Intermarket Analysis
- Our trading suggestion
We don’t base our trading decisions on things like earnings or fundamental cash flow valuations. However, we do look at them to better understand the financial landscape that a company is operating under.
Earnings are key to price movement on Chipotle stock. During the first six months of 2021, Chipotle earned about $3.6 billion in revenue, a 30% increase from the first six months of 2020. Because of these strong growth numbers, the stock has grown over 59% in the past year and over 119% since the start of 2020.
Wall Street Analysts’ Estimates of Chipotle
The 27 analysts offering 12-month price forecasts for Chipotle Mexican Grill Inc have a median target of $1,800.00, with a high estimate of $2,100.00 and a low estimate of $1,569.20. The median estimate represents a -3.91% decrease from the last price of $1,873.31. The stock is fairly valued at the present time.
52-Week High and Low Boundaries
Looking at the long-term chart of CMG provides us with the 52-week high and low boundaries.
Over the past year we have seen CMG trade as low as $1141.22 and as high as $1912.75. This tells us that the average weekly trading range for CMG is $14.83.
We look to amplify this value greatly when trading with the artificial intelligence.
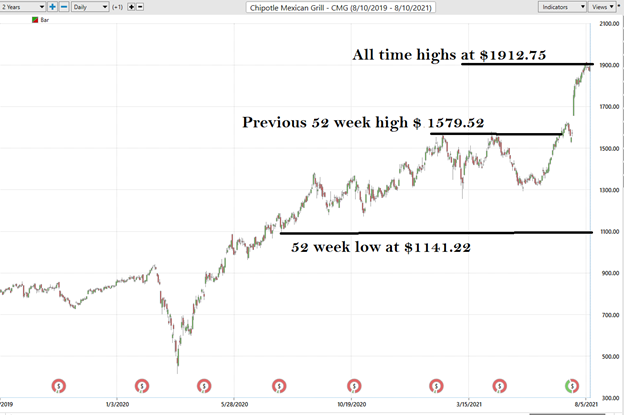
Up until June 30, 2021 the 52 week high was $1579.52. We advise traders to pay very close attention to a stock when it is trading at or near its 52-week high. There are several reasons for this. First off, whenever a stock is at the peak of its yearly range the stock and its price action are clearly communicating that it is at an important milestone. Secondly, when a stock successfully closeles above its 52-week high, it is often a clear cut signal that it will immediately thrust higher.
This is what has occurred with CMG over the last 6 weeks. CMG reported strong earnings while its stock was battling its 52-week high. Upon the strong earnings announcement the stock immediately rallied as much as 18% higher in 18 trading sessions.
Vantagepoint A.I. Forecast (Predictive Blue Line)
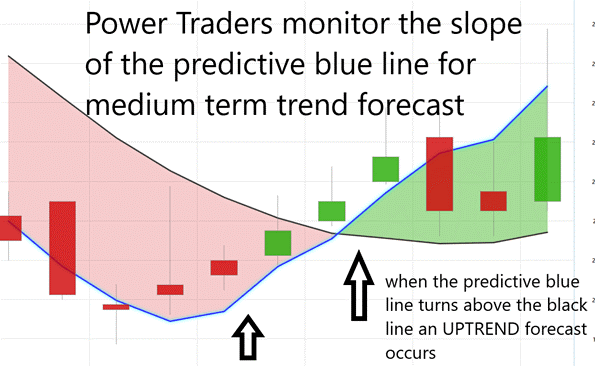
On the following chart you will see the power of the VantagePoint Predictive blue line which determines the medium term trend price forecast.
The guidelines we abide by are as follows:
- The slope of the predictive blue line determines the trend and general direction of CMG
- Ideally, the VALUE ZONE is determined to try and buy the asset at or below the predictive blue line.
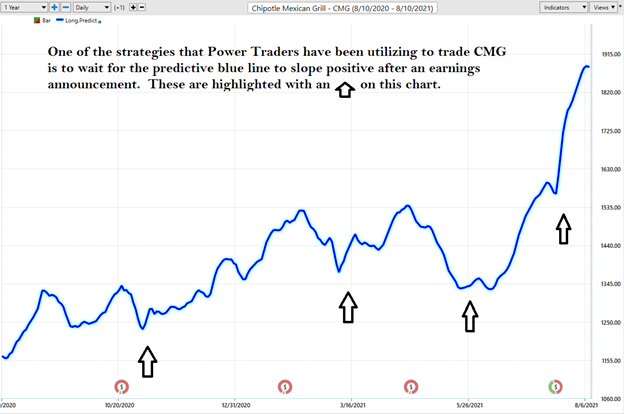
When you study this chart, one of the strategies that Power Traders have been utilizing to trade CMG is to wait for the predictive blue line to slope positive after an earnings announcement. Over the past year this has been a very effective way for medium-term swing traders and longer-term investors to positions themselves on the long side of this asset.
Naturally when the predictive blue line slopes lower traders would be anticipating lower prices and either moving to the sidelines or hedging their positions with options.
Using VantagePoint Software and the artificial intelligence, traders are alerted to trend forecasts by monitoring the slope of the predictive blue line.
The predictive blue line, however, utilizes the VantagePoint-patented Neural Network and Intermarket Analysis to arrive at its value. It looks at the strongest price drivers of an asset through artificial intelligence and statistical correlations to determine its value.
What is fascinating about the chart is that by simply eyeballing the 52-week chart we can see that this stock tends to fall faster than it rises. Over the last year CMG has had 5 retracements.
The rallies ranged from as short as 6 days to as long as 69 days and ranged from 12.6% to as high as 46%.
The declines ranged from 10 to 28 days and ranged from as little as 13% and as much as 20%.
In other words, the market takes longer to rally than it does to fall.
This price volatility is ideal for Swing Traders who can exploit the upside without having to experience the steep decline.
Neural Network Indicator (Machine Learning)
At the bottom of the chart is the Neural Network Indicator which predicts future short-term strength and/or weakness in the market. When the Neural Net Indicator is green it communicates strength. When the Neural Net is Red it is forecasting short term weakness in the market. When it is yellow it is anticipating sideways prices.
A Neural Net is a computational learning system that uses a network of functions to understand and translate massive amounts of data into a desired output, consistently monitoring itself and improving its performance.
We advocate that Power Traders cross reference the chart with the predictive blue line and neural network indicator to create optimal entry and exit points.
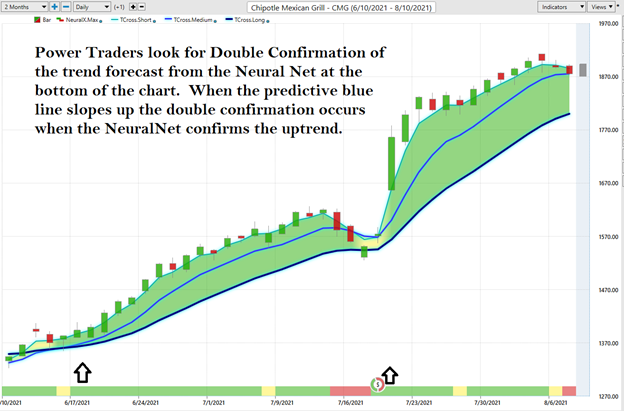
Traders look for confirmation on the NeuralNet to position themselves LONG or SHORT in the market. In other words, when the A.I. forecast is green, and The Neural Net is green, that presents a buying opportunity.
The inverse is also true, when the A.I. forecast is red and the Neural Net is red, that is a SELLING opportunity. The arrows on the chart below highlight the trading zones where Power Traders would’ve been using double confirmation for a BUY opportunity in cross-referencing the A.I. forecast with the NeuralNet.
Power Traders are always looking to apply both the Neural Network and A.I. to the markets to find statistically sound trading opportunities.
VantagePoint Software Daily Price Range Prediction
One of the powerful features in the VantagePoint Software which Power Traders use daily is the Price Range prediction forecast.
This forecast is what permits Power Traders to truly fine tune their entries and exits into the market.
Every day traders are faced with the anxiety and frustration of wondering where they should be looking to buy and sell the market. VantagePoint’s A.I. makes this decision super easy with the Daily Price Range Forecast.
For short term traders the important question that they have to confront every day is where should I buy? Where should I place my stop? Where should I sell? The Vantagepoint Daily Price Range forecast answers this question with precision.
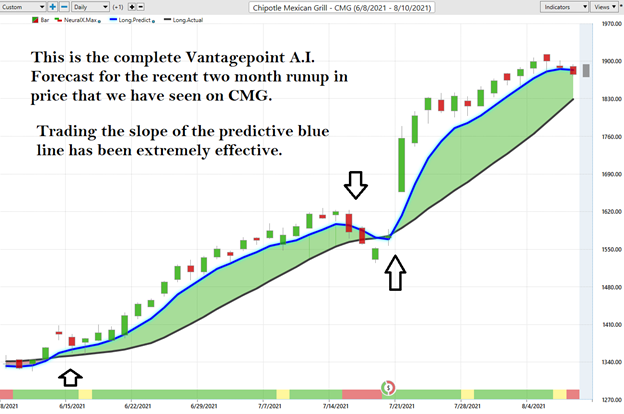
Here is the price chart of CMG during the most recent two-month run up featuring the Daily Price Range forecast with the Neural Net Indicator.
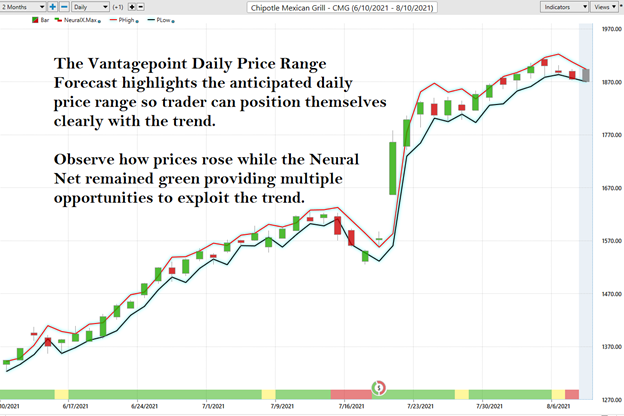
This chart helps traders decide where stop placement should occur. Observe how placing protective sell stops below the dark line on the chart was a powerful way to minimize risk on this trade.
See how the upper and lower bands of the price range forecast for a very clear channel of trading activity as well. Swing traders are always looking to buy towards the bottom of the predicted channel and try to sell above the top band.
Intermarket Analysis of Chipotle
Power lies in the way we respond to the truth we understand.
One of the supremely important questions in trading is what is driving the price? Headlines often create interesting narratives. But these “stories” only capture the imagination. Traders want and need to understand the cause and effect of price movement.
The only way to get an answer to this important question is through intermarket analysis which looks at statistical price correlations of assets.
We live in a global marketplace.
Everything is interconnected.

Interest rates, Crude Oil Prices, and the volatility of the Dollar amongst thousands of other variables affect the decisions companies must make to flourish and prosper in these very challenging times. Trying to determine what these factors are is one of the huge problems facing investors and traders.
You always have a choice. You can tune in to the talking heads in the media who spin talking points which promote fear. Or you can rely on facts to base your decision making on.
Within the following Intermarket Analysis graphic, you will see the 31 markets that are the key drivers to CMG’s price.
There is great value to be had in studying and understanding the key drivers of CMG’s price action. This graphic provides a microcosmic view of what factors have been driving CMG higher.
Trading Suggestion for Chipotle (CMG)
As I mentioned at the beginning of this Stock Study, CMG has a median target of $1,800.00, with a high estimate of $2,100.00 and a low estimate of $1,569.20. So, at the present time Chipotle is fairly valued by Wall Street Analysts. Earnings will be the key driver in Chipotle’s valuation moving forward.
The troublesome aspect of the stocks current valuation is that the stock is currently trading at 120 times earnings. Any way you look at it that is nosebleed level even for a top growth stock.
Traders are very aware that the spring correction in the stock price occurred when the P/E ratio reached 125. When this occurred, the stock slipped 17% in 28 trading sessions.
Management at Chipotle plans to open 4 new restaurants a week during 2021. Management also has very aggressive plans to increase restaurants internationally. While we think the stock might go higher there is much more risk now with the stock having recently made new all-time highs.
Chipotle’s next earnings call is scheduled for October 25, 2021. While there is a good possibility that the stock may trend higher the risk is also larger now. Traders who have been LONG should be looking to lighten up their positions. Long term support is at $1535 which represents an almost 20% drawdown from these levels.
Our suggestion is that there are better risk reward ratios in other markets at the present time. We do think Chipotle has great growth prospects longer term and would certainly entertain getting long again at lower price levels.
Our recommendation is to follow the A.I. trend analysis as outlined in this stock study and practice good money management on all trades.
We will re-evaluate based upon:
- New Wall Street Analysts’ Estimates
- New 52-week high and low boundaries
- Vantagepoint A.I. Forecast (Predictive Blue Line)
- Neural Network Forecast
- Daily Range Forecast
It’s Not Magic.
It’s Machine Learning.

IMPORTANT NOTICE!
THERE IS SUBSTANTIAL RISK OF LOSS ASSOCIATED WITH TRADING. ONLY RISK CAPITAL SHOULD BE USED TO TRADE. TRADING STOCKS, FUTURES, OPTIONS, FOREX, AND ETFs IS NOT SUITABLE FOR EVERYONE.
DISCLAIMER: STOCKS, FUTURES, OPTIONS, ETFs AND CURRENCY TRADING ALL HAVE LARGE POTENTIAL REWARDS, BUT THEY ALSO HAVE LARGE POTENTIAL RISK. YOU MUST BE AWARE OF THE RISKS AND BE WILLING TO ACCEPT THEM IN ORDER TO INVEST IN THESE MARKETS. DON’T TRADE WITH MONEY YOU CAN’T AFFORD TO LOSE. THIS ARTICLE AND WEBSITE IS NEITHER A SOLICITATION NOR AN OFFER TO BUY/SELL FUTURES, OPTIONS, STOCKS, OR CURRENCIES. NO REPRESENTATION IS BEING MADE THAT ANY ACCOUNT WILL OR IS LIKELY TO ACHIEVE PROFITS OR LOSSES SIMILAR TO THOSE DISCUSSED ON THIS ARTICLE OR WEBSITE. THE PAST PERFORMANCE OF ANY TRADING SYSTEM OR METHODOLOGY IS NOT NECESSARILY INDICATIVE OF FUTURE RESULTS. CFTC RULE 4.41 – HYPOTHETICAL OR SIMULATED PERFORMANCE RESULTS HAVE CERTAIN LIMITATIONS. UNLIKE AN ACTUAL PERFORMANCE RECORD, SIMULATED RESULTS DO NOT REPRESENT ACTUAL TRADING. ALSO, SINCE THE TRADES HAVE NOT BEEN EXECUTED, THE RESULTS MAY HAVE UNDER-OR-OVER COMPENSATED FOR THE IMPACT, IF ANY, OF CERTAIN MARKET FACTORS, SUCH AS LACK OF LIQUIDITY. SIMULATED TRADING PROGRAMS IN GENERAL ARE ALSO SUBJECT TO THE FACT THAT THEY ARE DESIGNED WITH THE BENEFIT OF HINDSIGHT. NO REPRESENTATION IS BEING MADE THAT ANY ACCOUNT WILL OR IS LIKELY TO ACHIEVE PROFIT OR LOSSES SIMILAR TO THOSE SHOWN.

