
Let’s go down the gold rabbit hole. As we do, be prepared to have your most cherished beliefs challenged as we try to understand the precious metal which has acted as a store of value for thousands of years.
Most mainstream economists and analysts despise gold. They refer to it as a barbarous relic. Warren Buffet refers to Gold as an unproductive asset because it does not pay interest or yield any dividends. That perspective might be valid in a world of high interest rates. But when interest rates are close to zero percent that perspective is certainly worth challenging.
About 18 months ago, it its latest 13F filing with the Securities Exchange Commission Berkshire Hathaway trimmed its exposure to the banking sector and surprised the investing community by taking a large position in Barrick Gold (GOLD).
This surprised traders and investors because Buffett has spent decades bashing gold as a poor investment. Traders online were mystified by his change of heart and tried to understand what he saw in the large precious metal mining company. Many of the conclusions on Berkshire Hathaway’s move were that this was a strategic play on Gold, Copper and a hedge against the massive deficit spending being done by the U.S. Treasury. Over the last 18 months $GOLD has lost about 10% in value.
One of the fascinating things about analyzing Gold is that to truly comprehend it you must have a multifaceted view. In other words, you must perceive Gold as a commodity, a currency, and potentially as a company. Americans have the distinct benefit of having the U.S. Dollar as the reserve currency of the world. This dollar centric perspective often overlooks how Gold is behaving when priced in other foreign currencies.
In this analysis, we will evaluate the GOLD market and look at it both as a commodity, a currency as well as a speculative play in mining companies. We will use the following benchmarks in our analysis:
- Gold as a Currency Analysis
- Valuing Gold as a Commodity
- Valuing Gold as a Wealth Creator through Mining Companies
- 52-week high and low boundaries
- Best Case and Worst Case Analysis
- Vantagepoint A.I. Forecast (Triple Cross)
- Neural Network Forecast
- Daily Range Forecast
- Intermarket Analysis
- Our Suggestion
We don’t base decisions on things like earnings or fundamental cash flow valuations.
Gold as a Currency Analysis
Gold is the “currency of last resort.” Historically it has proven to be a great store of value over time. One ounce of Gold in 1971 was worth $35. Today it is worth $1920. While 50 years have elapsed it is undeniable that GOLD maintains its purchasing power very well in the face of inflation which is unleashed by the government’s printing press.
To understand GOLD, we need to look at how GOLD has performed in comparison to all of the major foreign currencies over the past decade. This is the only way that we can objectively remove ourselves from a dollar centric bias.
I have taken the liberty of color coding these performance metrics for ease of understanding. Green= UP. Reddish Orange = DOWN. Simply look at the colors to see where the bleeding took place and where the money was made.
Here is what the performance metrics look like.
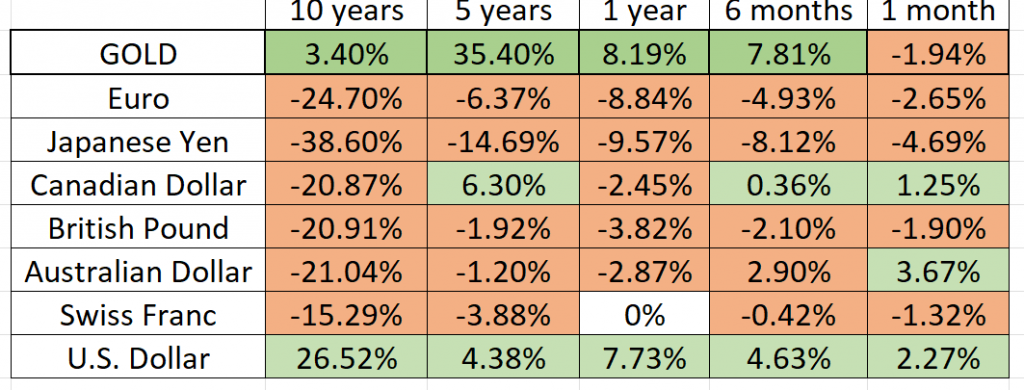
Gold has maintained its purchasing power against the dollar. But you can very quickly see that GOLD has been a far better store of value compared to ANY of the major foreign currencies.
In other words, our trading partners are seeing the value of their currency decline quite a bit in comparison to the price of Gold. Smart traders look at this grid when trading GOLD to get a better understanding of when Gold is trading as a commodity, or as a currency.
My conclusion in evaluating these metrics is that while GOLD is not yet in a bull market, it is very clear that foreign currencies are in a bear market in comparison to GOLD. Simply based upon this reality GOLD should be on your trading radar.
Valuing Gold as a Commodity
Next, we want to compare the return on GOLD to the major stock market indexes.
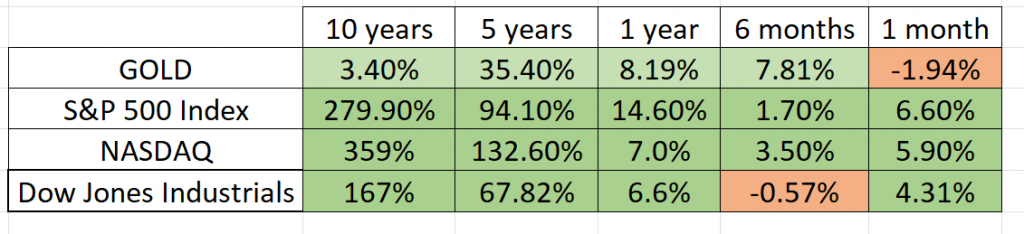
Over the last decade stocks have massively outperformed versus gold. But when you evaluate GOLD over the last year, 6 months, or month you will see that GOLD has kept pace with the broader stock market indexes.
As you evaluate these metrics keep in mind that the Consumer Price Index recently printed at 7.9% year over year.
Valuing Gold through Speculative Mining Companies
Next, we want to perform the same type of analysis and look at GOLD through the performance of some of the top mining companies in the world. When traders trade GOLD they often will choose to invest in a mining company. This often affords ease and greater leverage than owning and storing the physical metal.
The performance metrics speak for themselves. Over the past year, six months, and month, gold miners have outperformed the broader stock market indexes!
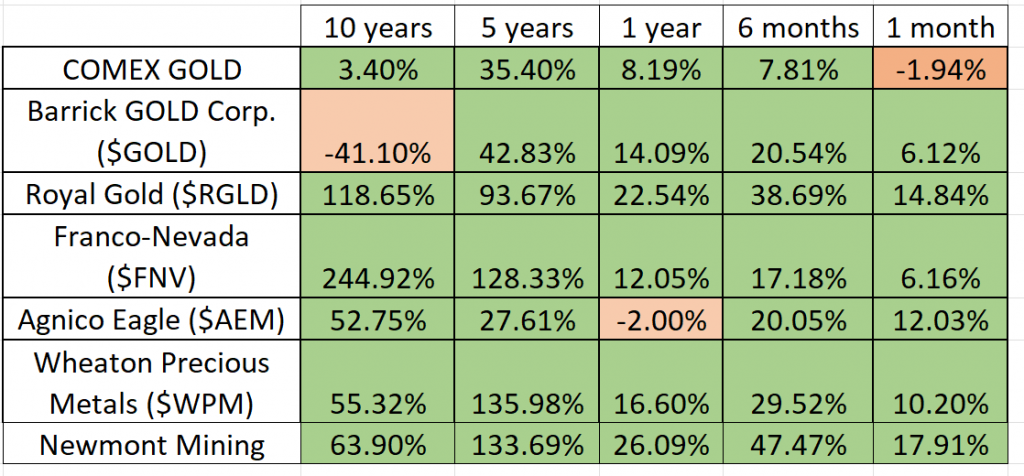
Over the last few weeks GOLD experienced a very sharp sell off when the CPI was announced. It fell 8.7% peak to trough. Yet despite this sell-off you can see that month over month the miners, for the most part have still remained positive and outperformed the broader stock market indexes.
Our conclusion so far is that Gold is not in a full-fledged bull market. It is more in sleeper mode. Most traders are unaware that it is performing positive against almost all-time frames when you price it as a stock, commodity, or currency.
52-week High-Low Chart
Next, we want to see where we are trading in relation to the 52-week range.
Over the last 52 weeks gold has traded as high as $2078.80 and as low as $1680.40. This provides us with an annual trading range of $398.80 When we divide this metric by 52 weeks, we can determine that the average weekly trading range for gold is $7.66.
What we often like to do as well is to divide the annual trading range ($398.80) by the current price ($1921) to provide us with a very basic and generic calculation of how the annualized volatility for GOLD, which is currently 20.7%.
What this number tells us is that we can define NORMAL during the next year if GOLD trades 20.7% higher or lower. That provides us with the following trading range as predicted by this basic volatility estimate.
Projected Annualized Volatility High Price = $2318
Projected Annualized Volatility Low Price = $1523
Whenever we trade, we always pay attention to where we are in relation to the 52-week trading range. It is very common to see the 52-week high provide very strong resistance to the market until it is breached. Often when the 52-week high is breached we will see the stock price explode higher very quickly over a very short period.
Gold is trading in its top 85th percentile of the last 12 months, even after its sharp selloff.
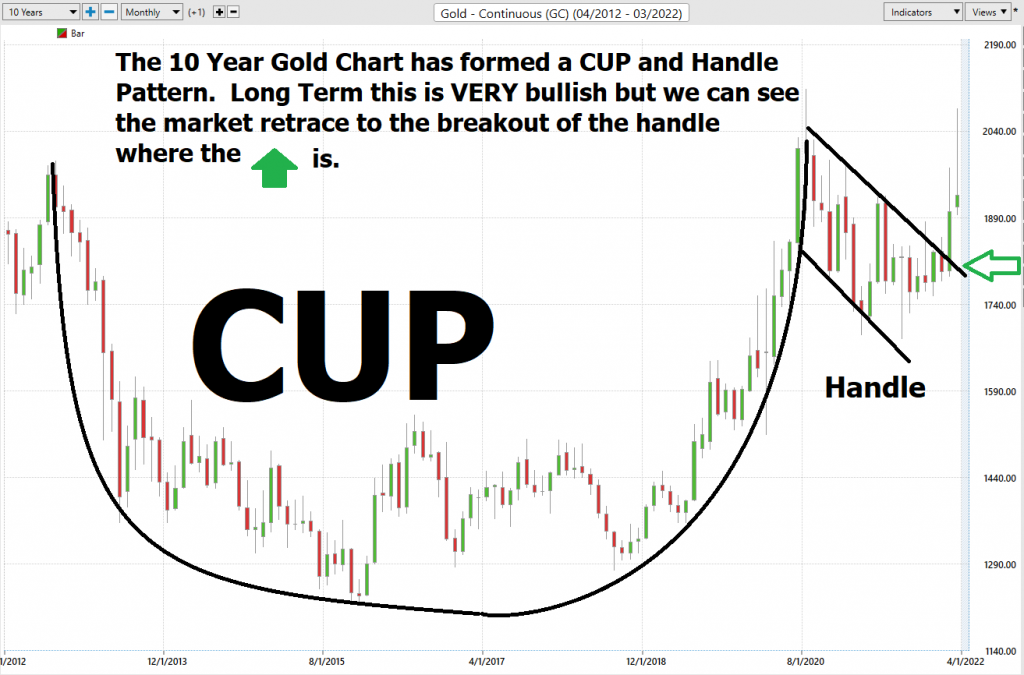
Currently, in GOLD we have an extremely unique and powerful setup which has developed. GOLD recently went to new 52-week highs which also is challenging its 10-year high boundary. Our experience has been that when an asset successfully breaches a 10-year high and 1 year high you should pay attention and place this candidate on your radar. These instances are rare and are indicative of an asset that is seeing growing interest.
Here is the 10-year cup and handle pattern on GOLD. Long-term this is very bullish. But it can take many months for the breakout from the handle to fully materialize. The market could retrace to $1790 and still not invalidate this long-term pattern.
Best Case – Worst-Case Scenarios
When we study the long term 52-week chart we can look at the best case and worst-case scenarios just to get an eyeball perspective of the risk and volatility of this asset. This is worth doing anytime you invest or trade to monetarily understand what the potential risks and rewards have been.
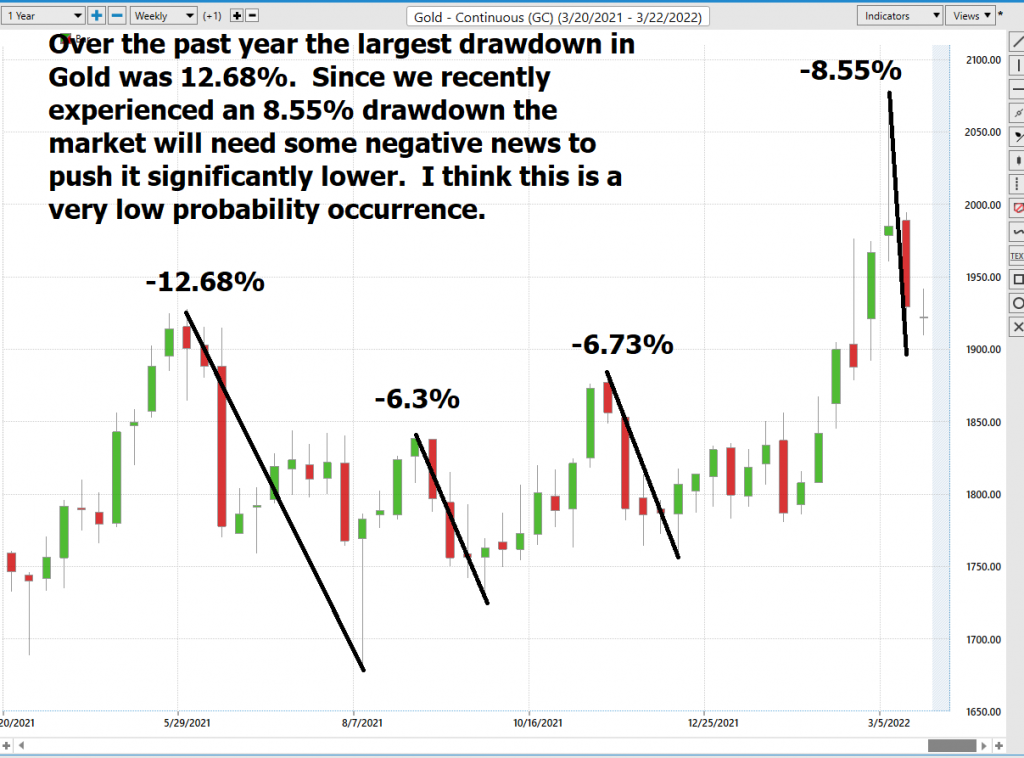
Here is a snapshot of the drawdowns in the gold market has experienced over the past year measured on a percentage basis.
It’s worth doing this type of baseline analysis because it allows you to quickly compare understand the performance of GOLD and to understand its risk and reward possibilities.
Next, we compare the gold market to the major broad market indexes. Over the past year:
GOLD +8.19%
S&P 500 Index +14.6%
Down Jones Industrials +6.6%
NASDAQ +7%
Russell 1000 Index +12.66%
So, in the gold market we have an asset that over the past year is keeping pace with half of the broader stock market indexes. Since the largest drawdown in Gold over the last year, peak to trough was 12.68% and we have already seen an 8.5% decline, it appears that the downside at the present is relatively limited.
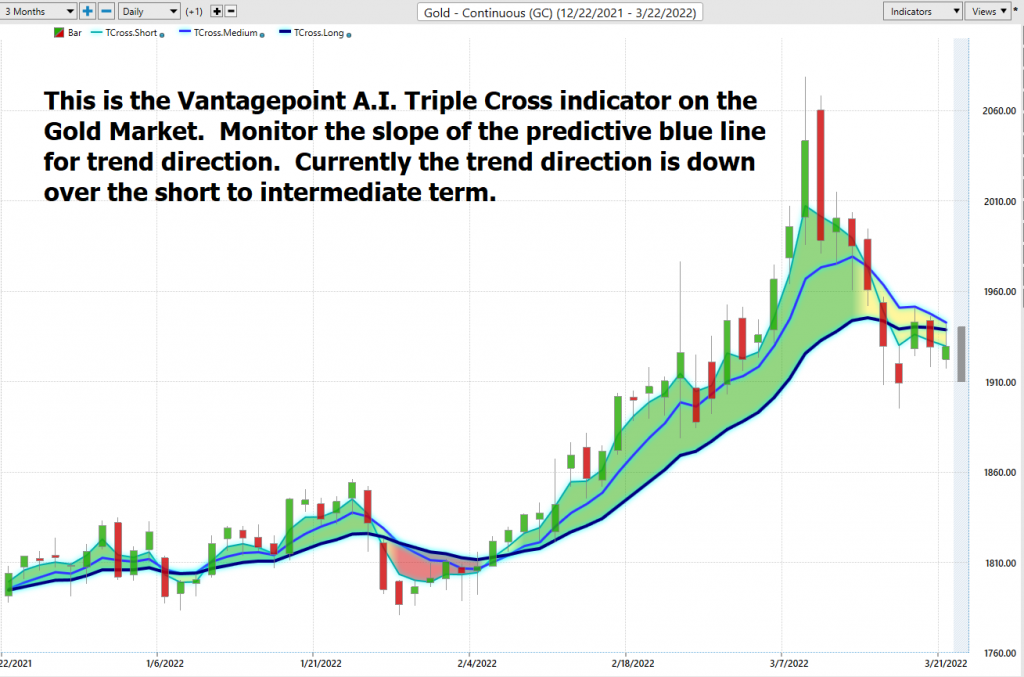
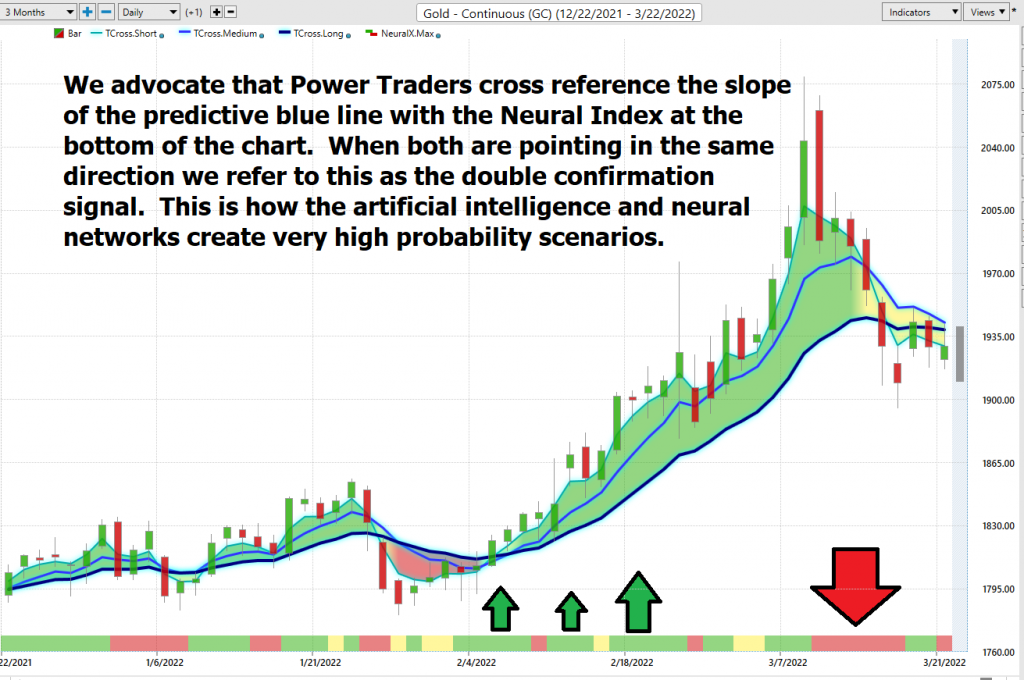
The Vantagepoint A.I. Analysis
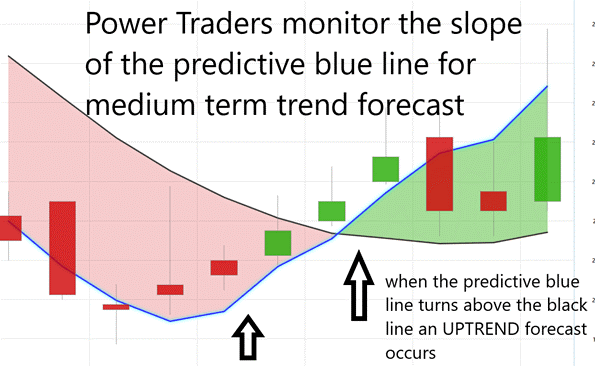
Using VantagePoint Software and the artificial intelligence, traders are alerted to trend forecasts by monitoring the slope of the predictive blue line. The black line is a simple 10 day moving average of price which simply tells you what has occurred in the market. The predictive blue line also acts as value zone where in uptrends traders try to purchase the asset at or below the blue line.
In studying the chart below pay close attention to the slope of the blue line.
Power Traders pay close attention to the relationship between where price closes in relation to the slope of the predictive blue line.
Power traders use the predictive blue line in helping to determine both the value zone as well as the trend direction. In other words, in an uptrend traders try to buy the asset at or below the predictive blue line.
Fine Tuning Entries with The Neural Net Indicator
At the bottom of the chart is the Neural Network Indicator which predicts future strength and/or weakness in the market. When the Neural Net Indicator is green it communicates strength. When the Neural Net is Red it is forecasting short term weakness in the market.
A Neural Net is a computational learning system that uses a network of functions to understand and translate massive amounts of data into a desired output, consistently monitoring itself and improving its performance.
Whenever Power Traders are looking for statistically valid trading setups, they look for a DOUBLE confirmation signal. This signal occurs whenever the blue predictive line and the Neural Net at the bottom of the chart suggest the same future expected outcome.
We advocate that Power Traders cross-reference the chart with the predictive blue line and neural network indicator to create optimal entry and exit points.
Power Traders are always looking to apply both the neural network and a.i. to the markets to find statistically sound trading opportunities.
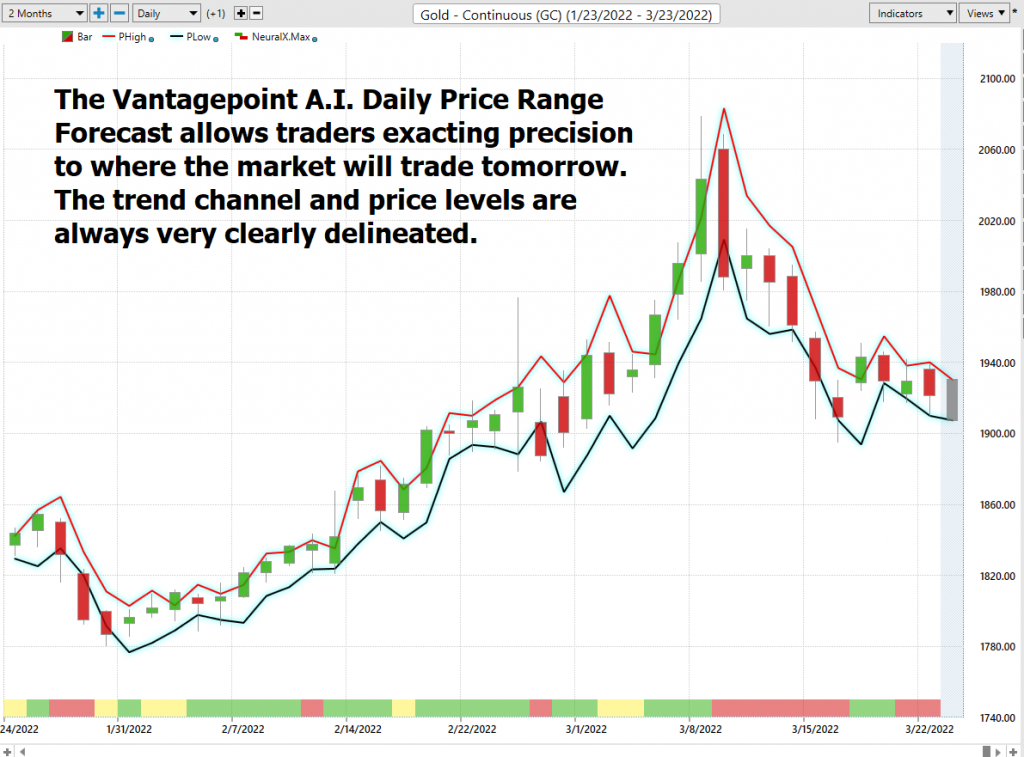
VantagePoint Software Daily Price Range Prediction
The purpose of all these indicators so far is to help traders stay on the right side of the right trend at the right time.
One of the powerful features in the Vantagepoint A.I. Software which Power Traders use daily is the Daily Price Range prediction forecast.
This forecast is what permits Power Traders to truly fine tune their entries and exits into the market often looking for smaller time frames and more granular trading opportunities.
Here is the price chart of GOLD during the most recent runup featuring the Daily Price Range forecast and the Neural Net Indicator.
Intermarket Analysis
What makes the Vantagepoint Software truly unique is its ability to perform Intermarket analysis and to locate those assets which are most interconnected that are responsible for driving the price of GOLD higher or lower.
Studying the charts can always provide objective realities in terms of locating support and resistance levels which become very clear on a chart. But we live in a global marketplace. Everything is interconnected. The billion-dollar question for traders is always what are the key drivers of price for the underlying asset that I am trading?
These intangibles are invisible to the naked eye yet show extremely high statistical correlations.
Slight changes in Interest rates, Crude Oil Prices, and the Volatility of the dollar amongst thousands of other variables affect the decisions companies must make to survive in these incredibly challenging times. Trying to determine what these factors are is one of the huge problems facing investors and traders.
I have taken the liberty of highlighting in RED the most positively correlated gold mining stocks to the price of GOLD. This analytical power at your fingertips is what intermarket analysis affords. With a simple push of a button, you can quickly find other gems that are tightly correlated to the price of the asset that you are looking to trade.
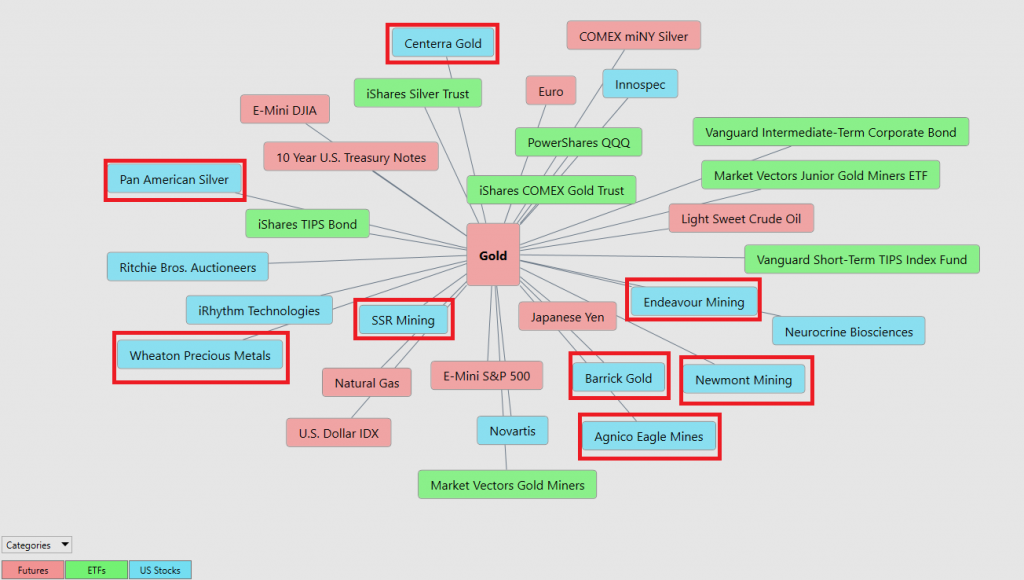
There is immense value to be had in studying and understanding the key drivers of gold price action.
By doing so you can often see which ETFs are most likely acquiring gold as well as uncovering other industries, commodities, forex which affect gold price movement.
Our Suggestion
In this analysis we looked at gold as a commodity, a currency and as a wealth creator through mining enterprises. While we are not in an official bull market yet in the yellow metal, we cannot get bearish based upon the simple reality that over the past year GOLD has kept pace with the broader stock market indexes and as a currency it is performing better than the currencies of any of the major G8 nations.
As I write these words, the trend is DOWN. Our expectations based upon drawdowns over the past year, we suspect it will be relatively mild. I am looking for an opportunity to get bullish and will wait for further guidance from the artificial intelligence. We strongly urge that you should put GOLD on your trading radar.
We urge all traders to practice good money management and allow the artificial intelligence to guide your decision-making process.
As mentioned earlier in this analysis whenever an asset makes 10-year highs you need to place it on your radar as it is communicating to the world that it is growing and overcoming all obstacles related to its success.
Aggressive traders who are option savvy could consider selling GOLD put options.
We also think it is a very empowering exercise to do this similar analysis on gold mining companies. They are showing tremendous resilience and we think their future will be very bright.
Let’s Be Careful Out There!
Remember, It’s Not Magic.
It’s Machine Learning.

IMPORTANT NOTICE!
THERE IS SUBSTANTIAL RISK OF LOSS ASSOCIATED WITH TRADING. ONLY RISK CAPITAL SHOULD BE USED TO TRADE. TRADING STOCKS, FUTURES, OPTIONS, FOREX, AND ETFs IS NOT SUITABLE FOR EVERYONE.
DISCLAIMER: STOCKS, FUTURES, OPTIONS, ETFs AND CURRENCY TRADING ALL HAVE LARGE POTENTIAL REWARDS, BUT THEY ALSO HAVE LARGE POTENTIAL RISK. YOU MUST BE AWARE OF THE RISKS AND BE WILLING TO ACCEPT THEM IN ORDER TO INVEST IN THESE MARKETS. DON’T TRADE WITH MONEY YOU CAN’T AFFORD TO LOSE. THIS ARTICLE AND WEBSITE IS NEITHER A SOLICITATION NOR AN OFFER TO BUY/SELL FUTURES, OPTIONS, STOCKS, OR CURRENCIES. NO REPRESENTATION IS BEING MADE THAT ANY ACCOUNT WILL OR IS LIKELY TO ACHIEVE PROFITS OR LOSSES SIMILAR TO THOSE DISCUSSED ON THIS ARTICLE OR WEBSITE. THE PAST PERFORMANCE OF ANY TRADING SYSTEM OR METHODOLOGY IS NOT NECESSARILY INDICATIVE OF FUTURE RESULTS. CFTC RULE 4.41 – HYPOTHETICAL OR SIMULATED PERFORMANCE RESULTS HAVE CERTAIN LIMITATIONS. UNLIKE AN ACTUAL PERFORMANCE RECORD, SIMULATED RESULTS DO NOT REPRESENT ACTUAL TRADING. ALSO, SINCE THE TRADES HAVE NOT BEEN EXECUTED, THE RESULTS MAY HAVE UNDER-OR-OVER COMPENSATED FOR THE IMPACT, IF ANY, OF CERTAIN MARKET FACTORS, SUCH AS LACK OF LIQUIDITY. SIMULATED TRADING PROGRAMS IN GENERAL ARE ALSO SUBJECT TO THE FACT THAT THEY ARE DESIGNED WITH THE BENEFIT OF HINDSIGHT. NO REPRESENTATION IS BEING MADE THAT ANY ACCOUNT WILL OR IS LIKELY TO ACHIEVE PROFIT OR LOSSES SIMILAR TO THOSE SHOWN.

