
![]()
Diana Shipping Inc. provides shipping transportation services. The company transports a range of dry bulk cargoes, including commodities, such as iron ore, coal, grain, and other materials in shipping routes worldwide. Diana Shipping Inc.’s fleet currently consists of 36 dry bulk vessels (4 Newcastlemax, 12 Capesize, 5 Post-Panamax, 5 Kamsarmax and 10 Panamax). The company has a market cap of $561 million and trades an average volume of 2.1 million share a day.
Shipping companies were hit hard at the beginning of the pandemic but began rebounding significantly as cargo rates boomed at the start of 2021. Shipping stocks become a valuable investment when the global economy and manufacturing sectors are doing well. The International Monetary Fund estimates that emerging economies will grow at a 6.7% rate this year. What has made the companies prospects look brighter on Wall Street is that as the world economy rebounds shipping companies are cyclical and DSX is perfectly positioned to rise with an economic rebound. Recently the company has signed lengthy agreements with manufacturers in China to transport their products worldwide.
In this weekly stock study, we will look at and analyze the following indicators and metrics as are our guidelines which dictate our behavior in deciding whether to buy, sell, or stand aside on a particular stock.
- Wall Street Analysts’ Estimates
- 52-week High and Low Boundaries
- The Best Case and Worst-Case Scenarios Over the Last Year
- Vantagepoint A.I. Forecast (Predictive Blue Line)
- Neural Network Forecast
- Daily Range Forecast
- Intermarket Analysis
- Our Trading Suggestion
Analysts Ratings
The 7 analysts offering 12-month price forecasts for Diana Shipping Inc have a median target of 6.50, with a high estimate of 9.50 and a low estimate of 4.60. The average estimate is $6.71 which is roughly 9% higher than where it is currently trading.
We expect Wall Street analysts to revise these estimates higher as the world economy rebounds.
Over the past 5 years, the management team of DSX have grown earnings 23.3% each year. Earnings are forecasted to grow as much as 78% in 2021.
52-Week High and Low Boundaries
Over the last 52 weeks the stock has traded as high as $6.31 and as low as $1.30. The annual trading range has been $5.01 which creates an average weekly trading range of just under .10. We look to amplify this value greatly when trading with a.i.
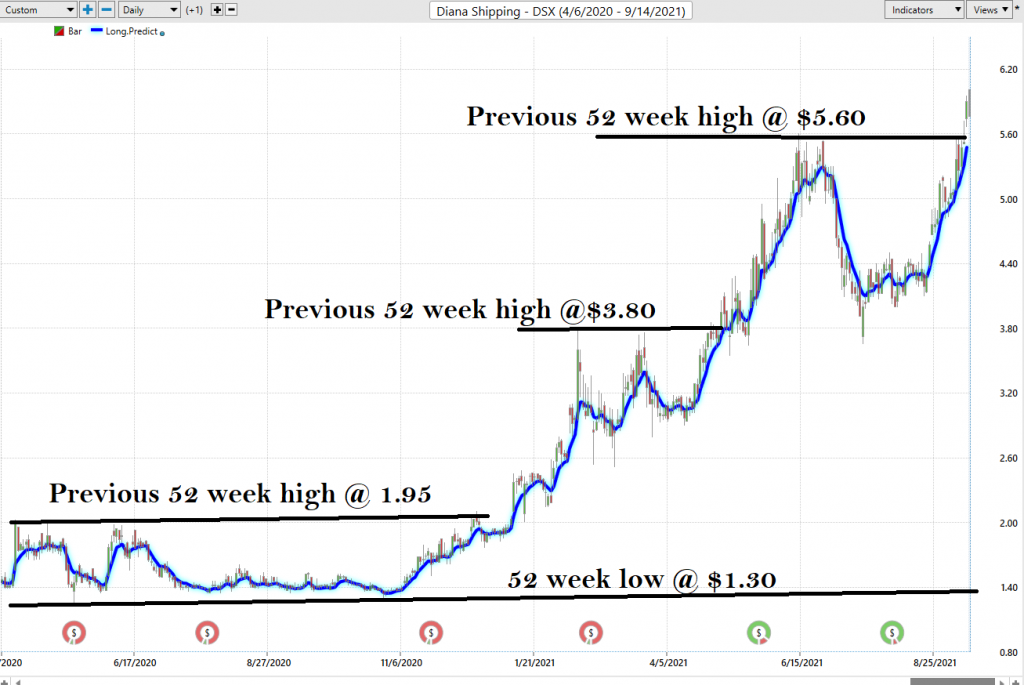
One of the ongoing and very important themes that we ascribe to is to trade and invest in markets that are making new 52-week highs. You will find repeatedly in our analysis that these market leaders are where you want to focus your time and energy on. By simply eyeballing the 52-week chart above you can see that when a stock successfully breaches and closes above its 52-week boundary it enters a new era of volatility and usually advances to a new level very quickly. This is exactly what has occurred with DSX.
Best Case – Worst Case Scenario
When we study the long term 52-week chart we can look at the best case and worst-case scenarios just to get an eyeball perspective of the risk and volatility of this asset. This is worth doing anytime you invest or trade to monetarily understand what the potential risks and rewards have been over the past year.
You can see that the stock falls much faster than it rises. Had you purchased DSX one year ago, you would have purchased just shy of the low at $1.40 and be sitting on gains of 320%. Quite impressive considering that the broader market indexes like the S&P 500 +30.63%, the Dow Jones Industrials is +23.51% and the Nasdaq +34.38%
DSX has had four sudden selloffs over the past year which ranged from 25% to 35%. What makes that worth emphasizing is that those drawdowns took place in as little as 6 trading sessions, but on average the declines lasted about 14 days.
Stated another way, had you had the unfortunate luck on purchasing DSX as it was breaking into a new 52-week range, chances are that you would have seen a 20% drawdown very quickly.
So, in DSX we have an asset which over the past year has massively outperformed the S&P 500 Index, The Dow Jones Industrials, and the NASDAQ. In the past year the worst-case downside was -33% and the best-case upside was +320%. But keep in mind this is considered a small cap stock with a market cap of $561 million. A few institutions in this asset can easily create massive volatility. A small-cap stock is generally defined as a company with a market capitalization of between $300 million and $2 billion. The advantage of investing in small-cap stocks is the opportunity to beat institutional investors through huge growth opportunities. The disadvantage is that traditionally small caps are much less liquid and more volatile than the broader market.
DSX is currently trading at a NEW 52 week high. By analysts estimates it is still slightly undervalued. We expect the current 52 week high at $6.31 to be broken soon as the most recent rally has been accompanied on very solid volume. The upside potential is great but so is the risk. We must emphasize that since this is a small cap stock you have to be prepared for volatility that is very much larger than the broader market.
Earnings dates have also been a key driver in DSX price action. Power Traders have done very well following the trend of the predictive blue line into an earnings announcement. The next DSX earnings call is slated for approximately November 3, 2020.
This is a powerful narrative that can quickly see DSX continue to post huge gains in the near future.
The Vantagepoint A.I. Analysis
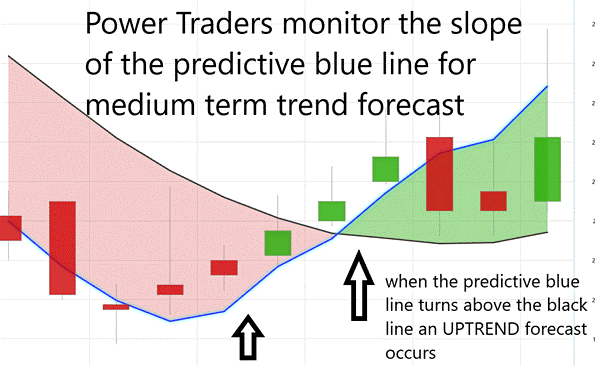
Using the Vantagepoint A.I. Software traders were alerted that the ideal value zone on this uptrend was trying to purchase DSX at or below the predictive blue line on the chart.
Power traders use the predictive blue line in helping to determine both the value zone as well as the trend direction. I have taken the liberty of charting the predictive blue line directly underneath the price bars so that you can see its effectiveness in forecasting the trend.
The vertical lines show the most conservative interpretation of where the UP forecasts were created in DSX. There were multiple times during the year when Power Traders used this indicator to very effectively swing trade DSX. The average weekly trading range in DSX has been .10. While this sounds very small keep in mind that the stock was trading at $1.40 a year ago. There were numerous opportunities to swing trade DSX for 20% or greater in a matter of days.
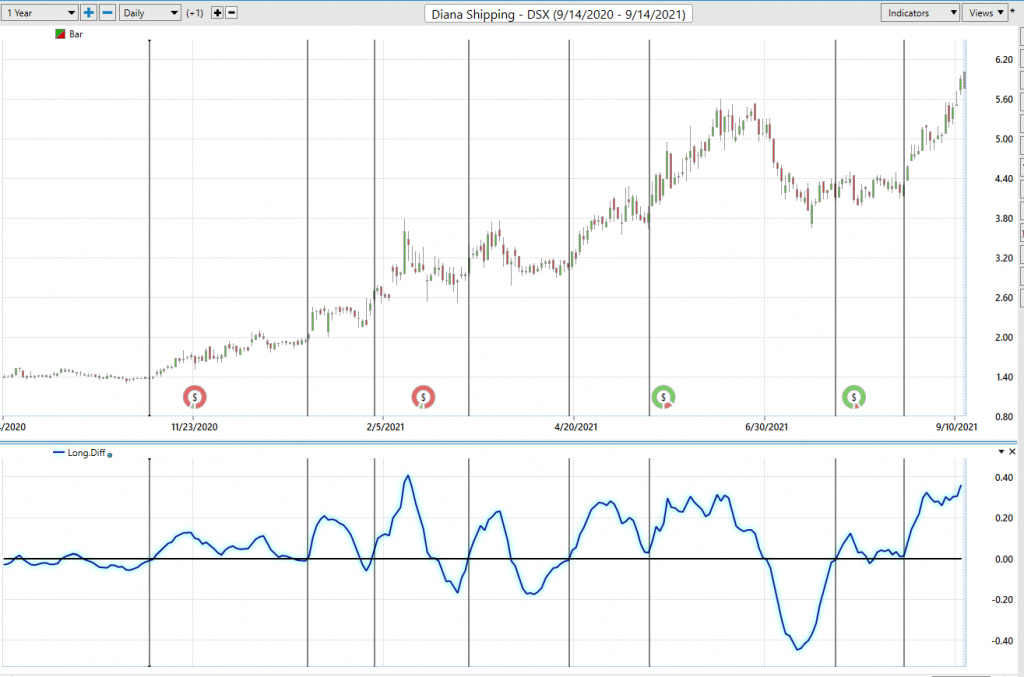
Neural Network Forecast
At the bottom of the chart is the Neural Network Indicator which predicts future strength and/or weakness in the market. When the Neural Net Indicator is green it communicates strength. When the Neural Net is Red it is forecasting short-term weakness in the market.
We advocate that Power Traders cross-reference the chart with the predictive blue line and neural network indicator to create optimal entry and exit points.
A Neural Net is a computational learning system that uses a network of functions to understand and translate massive amounts of data into a desired output, consistently monitoring itself and improving its performance.
Power Traders are always looking to apply both the neural network and A.I. to the markets to find statistically sound trading opportunities. We refer to this as a “double confirmation” setup and look for the predictive blue line to slope higher and to be confirmed by the NeuralNet at the bottom of the chart.
Traders look for confirmation on the NeuralNet to position themselves LONG or SHORT in the market. In other words, when the A.I. forecast is green, and The Neural Net is green, that presents a statistically sound buying opportunity.
The inverse is also true, when the A.I. forecast is red and the Neural Net is red, that is a SELLING opportunity. The arrows on the chart above highlight the areas where the “double confirmation setup occurred.” As you can see prices traded sideways after the first double confirmation signal but exploded higher on the second double confirmation signal rallying sharply from $4.50 per share to the recent highs at 6.30 a gain of 34% in 16 trading sessions.
Power Traders have had multiple opportunities to exploit nice gains in DSX by monitoring the artificial intelligence forecasts.
Daily Range Forecast – Entries and Exits
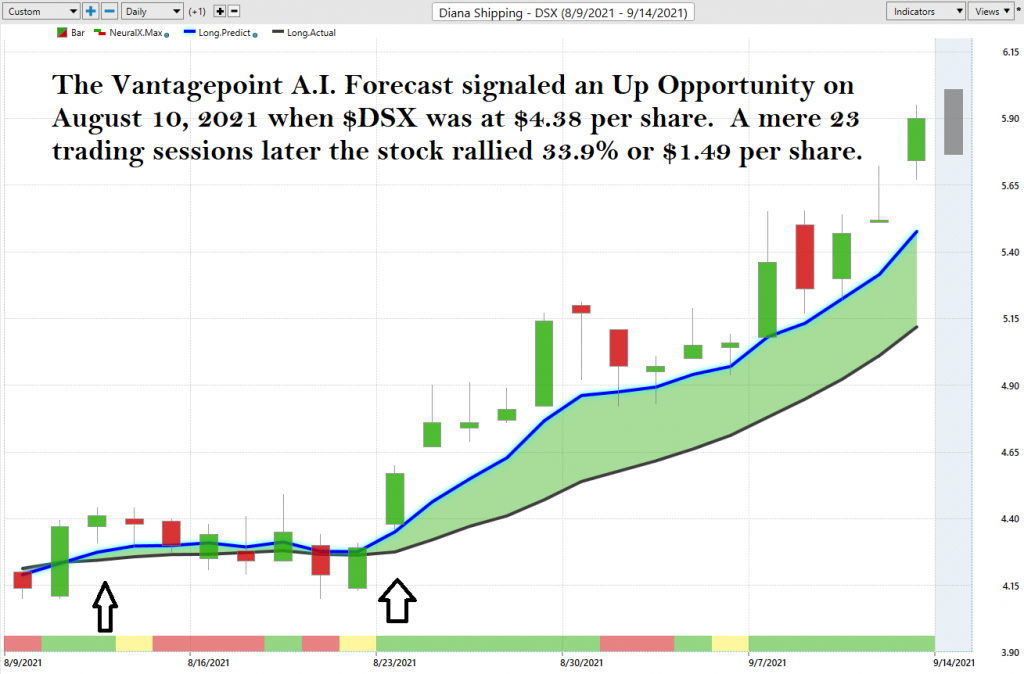
One of the powerful features in the Vantagepoint A.I. Software which Power Traders use daily is the Price Range prediction forecast.
This forecast is what permits Power Traders to truly fine tune their entries and exits into the market.
At 6:30pm after the market close the software updates and all of the price predictions change based upon what the machine learning, A.I., neural networks, and intermarket analysis anticipate moving forward.
Zoom in on the last eight weeks of price action and you can see for yourself how the A.I. and machine learning combine to create a very accurate daily price range forecast that keep traders focused on optimal trade placement.
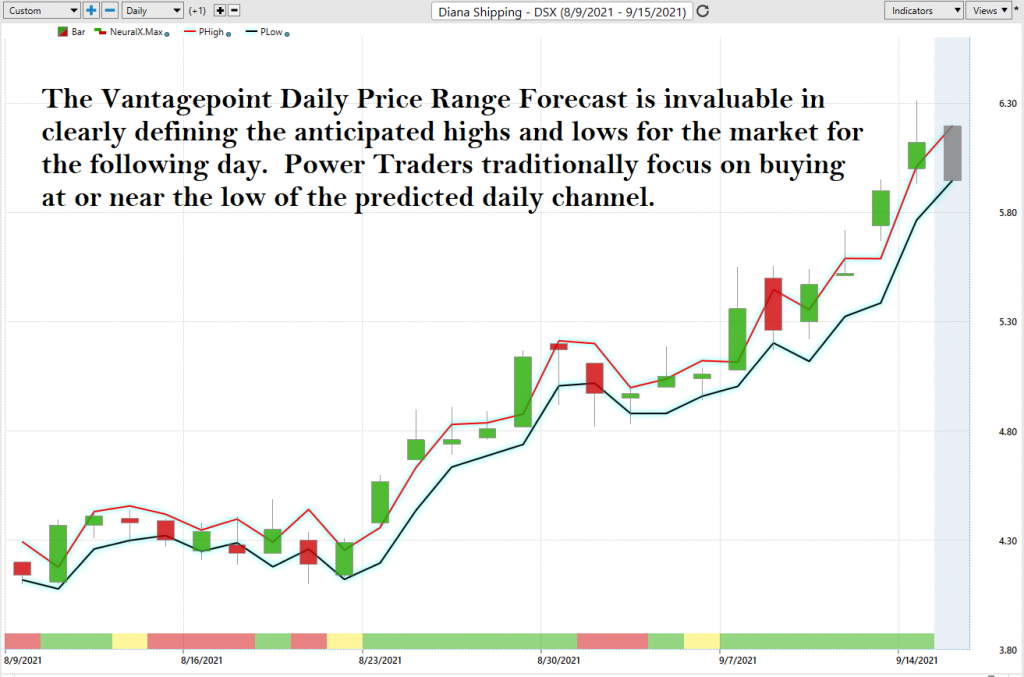
Power Traders use a price level below the predictive low price to place their protective sell stops in the market in case a sudden reversal was to occur. Observe how the predictive price low also provided numerous short term entry opportunities for traders to buy DSX as it was trending higher.
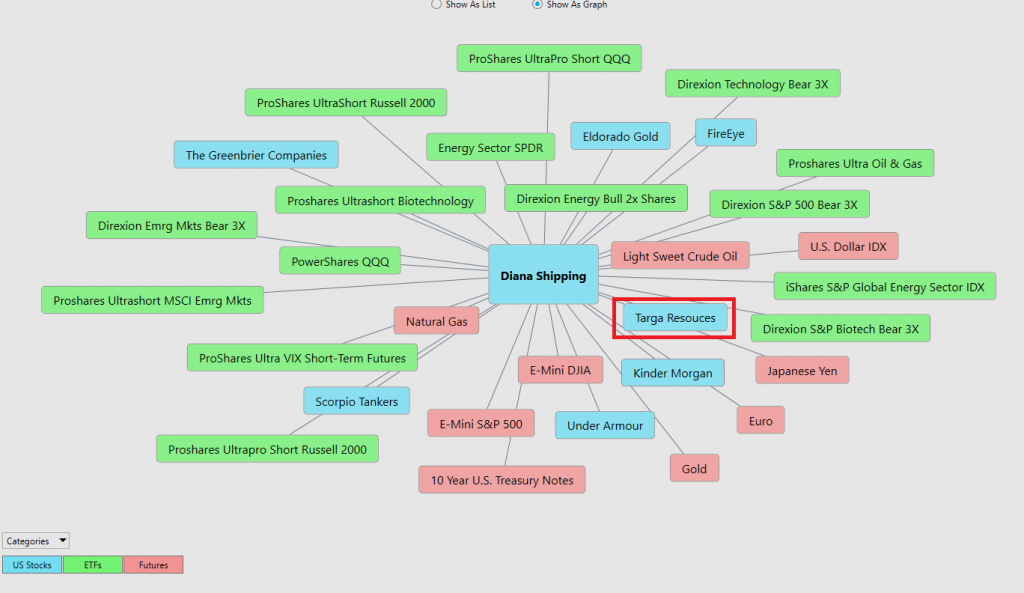
Intermarket Analysis
We live in a global marketplace. Everything is interconnected. The billion-dollar question for traders is always what are the key drivers of price for the underlying asset that I am trading?
Small changes in Interest rates, Crude Oil Prices, and the Volatility of the dollar amongst thousands of other variables affect the decisions companies must make to survive in these very challenging times. Trying to determine what these factors are is one of the huge problems facing investors and traders.
There is great value to be had in studying and understanding the key drivers of DSX price action. universe and the most statistically correlated assets. These factors are all displayed from a standpoint of statistical correlations which show the strongest interconnectedness of prices.
Instead of watching the financial media the Vantagepoint Software provides the 31 key drivers of price. This patented technology allows traders to discover other opportunities that in the financial marketplace that you would otherwise be oblivious to.
For example, traders who had been trading and monitoring DSX would have noticed that one of the key drivers was Targa Resources ($TGRP) which over the past year is up 175%!
The intermarkets also locate markets that are inversely correlated which means that as DSX moves higher the inversely correlated markets will move lower. These hidden gems are priceless in that traders locate solid downtrends that are just as easily exploited. In looking over the intermarkets you will find several Crude Oil Petroleum resource stocks which have recently been decimated.
Trading Suggestion
The age-old question for traders and investors is to find a way to position themselves in an asset while simultaneously reducing risk. This is much easier to accomplish for savvy option traders because options have built in risk management features.
We like DSX. It’s a cyclical play that should do well as global growth recovers from the pandemic. Just remember this is a small cap stock, so you need to be aware volatility will be much, much greater than the broader stock market indexes. We urge you to practice good money management – meaning that you would only commit a small percentage of your trading portfolio to an asset like this.
We like the reality that the stock is still undervalued by Wall Street Analysts estimates, and the most optimistic Wall Street Analysts still think the stock has potential to run another 50%. Just looking at the history of this asset you need to be able to hold the position should it sell off 20% which while we think it unlikely it is still very possible as a small cap stock.
While options in theory do trade on DSX they are very thinly traded which means that they are highly illiquid. In other words, the spreads between the bid and the offer are huge. For this reason, options tactics are not attractive in DSX as I write these words.
We like the idea of swing trading DSX in here. We expect pullbacks towards the bottom end of the daily forecast channel that will give us the opportunity to get long and then sell as the market rallies into new high ground. Our expectation is that the recent high at $631 will provide some short-term choppiness. If the A.I. forecast remains up we think there will be good opportunity to buy DSX in and around the $5.85 range.
The narrative in DSX is explosive. As a small cap stock with a market cap of only $500 million all it takes is a handful of institutions coming into this asset and you can see prices rally much, much higher very quickly.
Our recommendation is to follow the A.I. trend analysis as outlined in this stock study and practice good money management on all trades.
We will re-evaluate based upon:
- New Wall Street Analysts’ Estimates
- New 52-week high and low boundaries
- Vantagepoint A.I. Forecast (Predictive Blue Line)
- Neural Network Forecast
- Daily Range Forecast
Let’s Be Careful Out There!
Remember, It’s Not Magic.
It’s Machine Learning.

IMPORTANT NOTICE!
THERE IS SUBSTANTIAL RISK OF LOSS ASSOCIATED WITH TRADING. ONLY RISK CAPITAL SHOULD BE USED TO TRADE. TRADING STOCKS, FUTURES, OPTIONS, FOREX, AND ETFs IS NOT SUITABLE FOR EVERYONE.
DISCLAIMER: STOCKS, FUTURES, OPTIONS, ETFs AND CURRENCY TRADING ALL HAVE LARGE POTENTIAL REWARDS, BUT THEY ALSO HAVE LARGE POTENTIAL RISK. YOU MUST BE AWARE OF THE RISKS AND BE WILLING TO ACCEPT THEM IN ORDER TO INVEST IN THESE MARKETS. DON’T TRADE WITH MONEY YOU CAN’T AFFORD TO LOSE. THIS ARTICLE AND WEBSITE IS NEITHER A SOLICITATION NOR AN OFFER TO BUY/SELL FUTURES, OPTIONS, STOCKS, OR CURRENCIES. NO REPRESENTATION IS BEING MADE THAT ANY ACCOUNT WILL OR IS LIKELY TO ACHIEVE PROFITS OR LOSSES SIMILAR TO THOSE DISCUSSED ON THIS ARTICLE OR WEBSITE. THE PAST PERFORMANCE OF ANY TRADING SYSTEM OR METHODOLOGY IS NOT NECESSARILY INDICATIVE OF FUTURE RESULTS. CFTC RULE 4.41 – HYPOTHETICAL OR SIMULATED PERFORMANCE RESULTS HAVE CERTAIN LIMITATIONS. UNLIKE AN ACTUAL PERFORMANCE RECORD, SIMULATED RESULTS DO NOT REPRESENT ACTUAL TRADING. ALSO, SINCE THE TRADES HAVE NOT BEEN EXECUTED, THE RESULTS MAY HAVE UNDER-OR-OVER COMPENSATED FOR THE IMPACT, IF ANY, OF CERTAIN MARKET FACTORS, SUCH AS LACK OF LIQUIDITY. SIMULATED TRADING PROGRAMS IN GENERAL ARE ALSO SUBJECT TO THE FACT THAT THEY ARE DESIGNED WITH THE BENEFIT OF HINDSIGHT. NO REPRESENTATION IS BEING MADE THAT ANY ACCOUNT WILL OR IS LIKELY TO ACHIEVE PROFIT OR LOSSES SIMILAR TO THOSE SHOWN.

