
Formerly known as the Standard Oil Company of New Jersey, Exxon Mobil ($XOM) is one of the largest petroleum companies in the world, and the largest in the United States, with a market cap of 342.19 billion. The company was founded by John D. Rockefeller in 1882 and is headquartered in Irving, TX.
Over the past month, $XOM shares have rallied sharply even while most Wall Street Analysts have remained neutral on the shares. Exxon has continued very successfully finding new oil reserves off the coast of Guyana. It’s believed the reserves will total over 10 billion barrels.
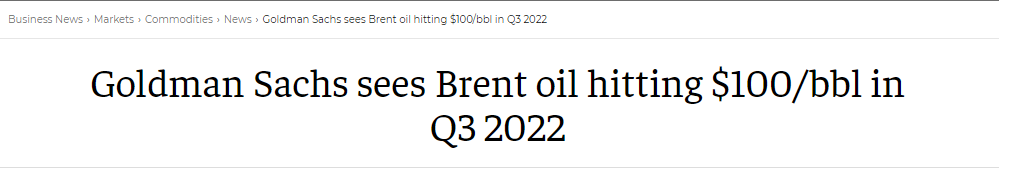
Over the past 6 months, we at Vantagepoint AI have urged Power Traders to pay very close attention to the oil and gas sector of the markets. Reason being inflation is at 40-year highs and top Wall Street analysts are forecasting that Crude Oil will surpass $100 per barrel in 2022. A rising tide of this manner creates trends that we as traders can exploit.
The company is also in the process of liquidating assets in Europe, Africa and Asia that are expected to reach $25 billion through 2025. The proceeds from these reserves are expected to be applied to the oil field in Guyana.
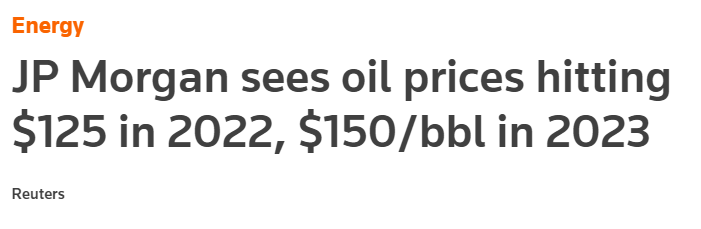
High inflation and high Crude prices are very tightly correlated, and we think this trend is only beginning. As the world recovers from a pandemic and collapse in oil prices, simply recall how 20 months ago Crude Oil experienced negative prices, shocking the financial markets. Observe how Crude Oil is now trading above $80 a barrel. We think this sector is potentially explosive in the months ahead.
In this weekly stock study, we will look at and analyze the following indicators and metrics as are our guidelines which dictate our behavior in deciding whether to buy, sell, or stand aside on a particular stock.
- Wall Street Analysts’ Estimates
- 52-week high and low boundaries
- Best Case – Worst Case Analysis
- Vantagepoint A.I. Forecast (Predictive Blue Line)
- Neural Network Forecast
- Daily Range Forecast
- Intermarket Analysis
- Our trading suggestion
We don’t base our decisions on things like earnings or fundamental cash flow valuations. However, we do look at them to better understand the financial landscape that a company is operating under.
Analysts Ratings
The first set of boundaries which we explore in our stock study is what do the professionals think who monitor the stock for a living. We can acquire this information by simply looking at the boundaries that the top Wall Street Analysts set for $XOM. This initial set of boundaries provides us with an idea of what is expensive, fairly valued, and cheap.
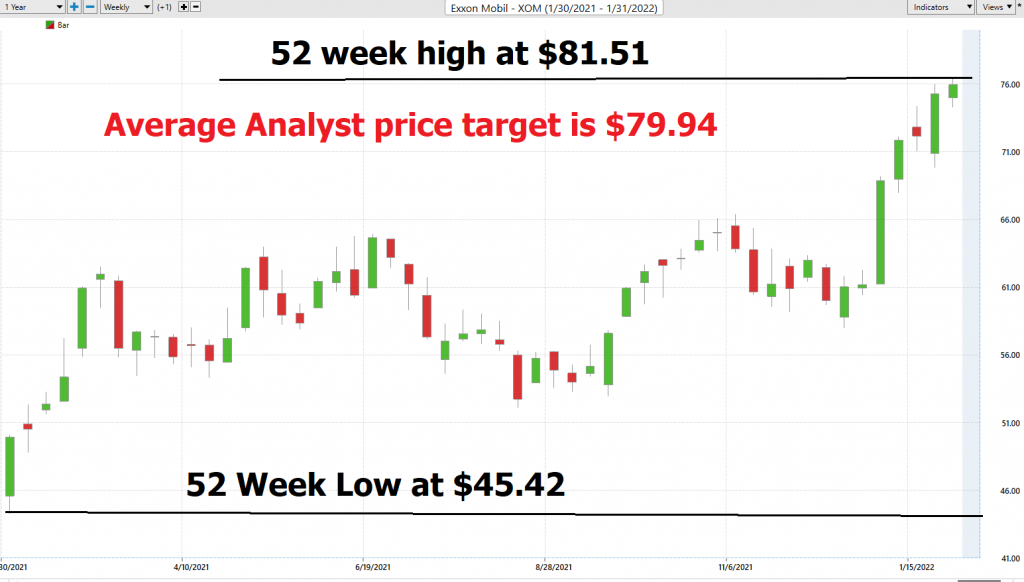
Based on 16 Wall Street analysts offering 12-month price targets for Exxon Mobil in the last 3 months. The average price target is $79.94 with a high forecast of $100.00 and a low forecast of $62.00. The average price target represents a -1.10% change from the last price of $80.83.
From this simple analysis we can see that $XOM is above fair value at present time but some on Wall Street think that is has the potential to run to as high as $100 per share.
52-week High-Low Chart
Where the rubber meets the road as far as analysis is concerned is looking at the charts and evaluating where the asset stands in relation to its 52-week highs. As counterintuitive as it may sound, great stocks tend to consistently make new 52-week highs.
One of the simplest ways to evaluate a stock is to look at some long term monthly and weekly charts to be able to zoom out and see the big picture of the trend. Some of the greatest traders in the world use the longer-term monthly charts to determine trend analysis.
Whenever we trade, we always pay attention to where we are in relation to the 52-week trading range. It is very common to see the 52-week high provide very strong resistance to the market until it is breached. Often when the 52-week high is breached we will see the stock price explode higher very quickly over a very short period.
$XOM continues to make new 52-week highs. Over the last 5 weeks $XOM has made a new 52 week high each week.
We have learned from years and years of observation, that stocks which breach their 52-week highs multiple times a year are often in very strong trends which we want to be aware of. The 52-week boundary often acts as significant resistance in thwarting trends. As price bounces off this level, we want to become extremely focused on what the artificial intelligence forecast is signaling.
$XOM has traded as high as $81.51 and as low as $45.42 over the last 52 weeks. Its annual trading range has been $36.02 which means that its average weekly trading range has been .69.
We also like to take the annual trading range of $36.09 and divide it by the current price of $79.78 to calculate a broad-based measure of volatility. This tells us that the current volatility is 45.25% which tells us that everything would be considered statistically normal in one year if $XOM was trading 45% higher or lower from current levels according to this measure.
Best Case – Worst Case Analysis
Next, we want to evaluate $XOM is in comparison to the performance of the major stock market indexes which we have greater familiarity with and then look at the drawdowns of the stock over the past year to get a worst-case scenario idea for any conclusions that we might reach when we trade this asset.
- Over the past year $XOM is up 51.6%.
- The Dow Jones Industrials are up 15.4% over the past year.
- S&P 500 is UP 19.46% over the last year.
- Russell 1000 Small Cap is up 16.06 % in the past year.
- The NASDAQ is up 27.28%
You can see $XOM performed substantially better than the broader market indexes. Rest assured that Wall Street traders and investors are also very aware of this and they will start rotating out of the broader market indexes and into Oil stocks should a recession or high inflation continue to plague the economy.
What were the worst-case drawdowns? The graphic below shows the bumpy ride.
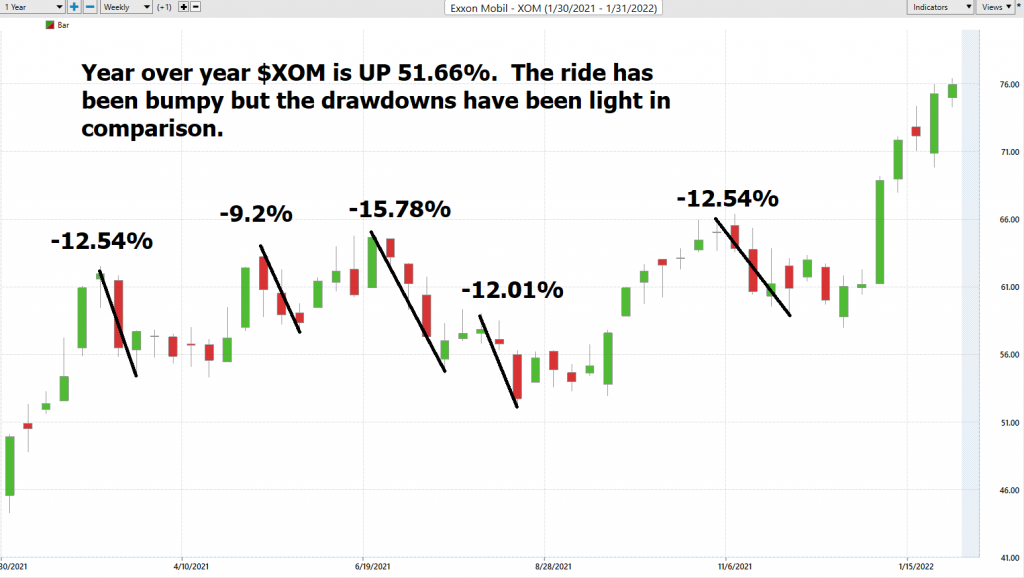
We would expect this type of volatility to continue. This means that 10%+ drawdowns peak to trough should be considered very normal moving forward. Power Traders should have $XOM on their radar and pay attention when this occurs.
The Vantagepoint A.I. Analysis
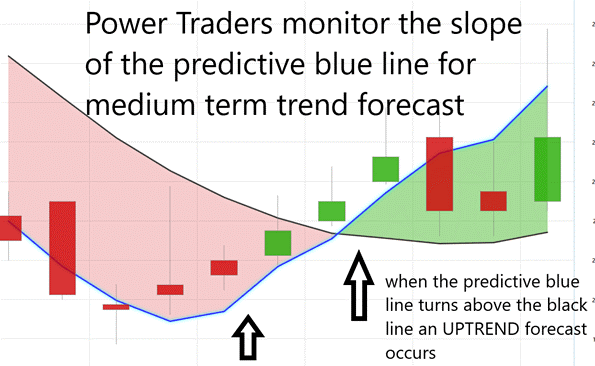
Using VantagePoint Software and the artificial intelligence, traders are alerted to trend forecasts by monitoring the slope of the predictive blue line. The black line is a simple 10 day moving average of price which simply tells you what has occurred in the market. The predictive blue line also acts as value zone where in uptrends traders try to purchase the asset at or below the blue line.
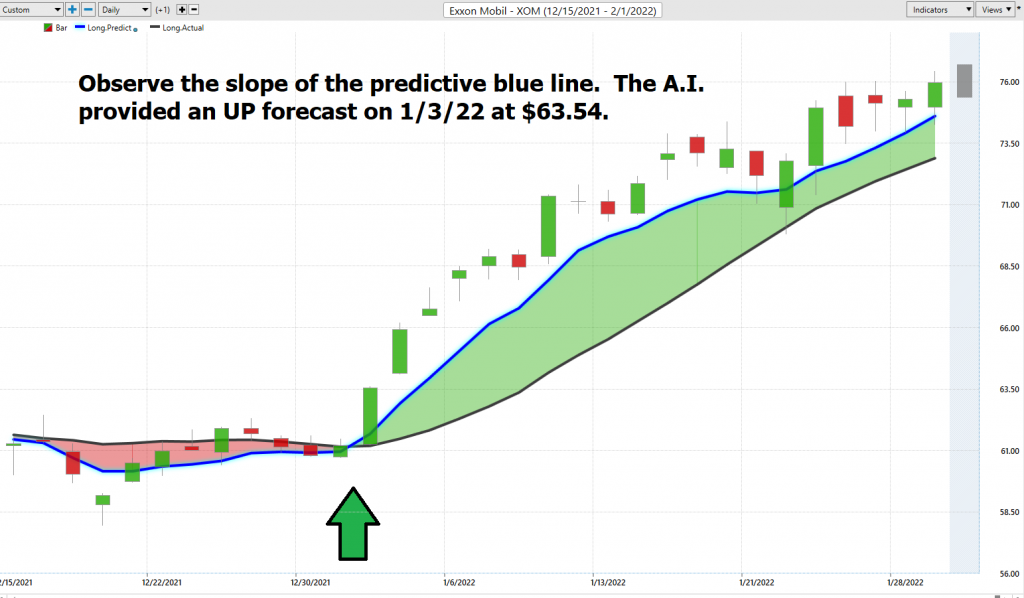
In studying the chart below, pay close attention to the relationship between the black line and predictive blue line. All that the black line tells you is what has occurred. It tells you where prices have been and what the average price over the last ten days is.
The predictive blue line, on the other hand utilizes that Vantagepoint patented Neural Network and Intermarket Analysis to arrive at its value. It looks at the strongest price drivers of an asset through artificial intelligence and statistical correlations to determine its value.
The a.i. provided an UP forecast on 1/3/22 at $63.54 per share. In 4 short weeks prices have rallied to over $81 per share.
Whenever we see the predictive blue line move above the black line, we are presented with an UP-forecast entry opportunity. These are highlighted by UP arrows on the chart.
Whenever the predictive blue line moves below the black line, we are presented with a DOWN forecast. More importantly, there is no guesswork involved. Traders know where the value zone and trend are at all times.
Fine Tuning Entries with The Neural Net Indicator
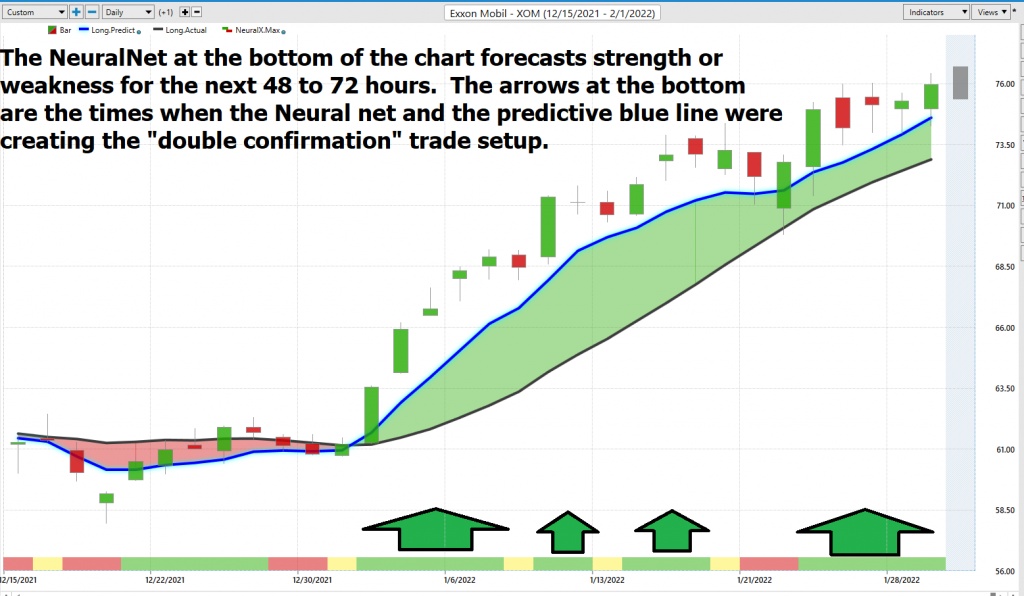
At the bottom of the chart is the Neural Network Indicator which predicts future strength and/or weakness in the market. When the Neural Net Indicator is green it communicates strength. When the Neural Net is red it’s forecasting short term weakness in the market.
We advocate that Power Traders cross reference the chart with the predictive blue line and neural network indicator to create optimal entry and exit points.
A Neural Net is a computational learning system that uses a network of functions to understand and translate massive amounts of data into a desired output, consistently monitoring itself and improving its performance.
Power Traders are always looking to apply both the neural network and A.I. to the markets to find statistically sound trading opportunities. We refer to this as a “double confirmation” setup and look for the predictive blue line to slope higher and to be confirmed by the Neural Net at the bottom of the chart.
We advise Power Traders to cross reference the predictive blue line with the Neural Net for the best entry opportunities. Observe how the slope of the predictive blue line has remained positive from the time earnings were announced.
You can see in the chart above how the Neural Net offered several opportunities of double confirmation to Power Traders, when the predictive blue line and the Neural Net aligned with the same forecast. These instances provide very high probability trading opportunities to exploit the trend.
VantagePoint Software Daily Price Range Prediction
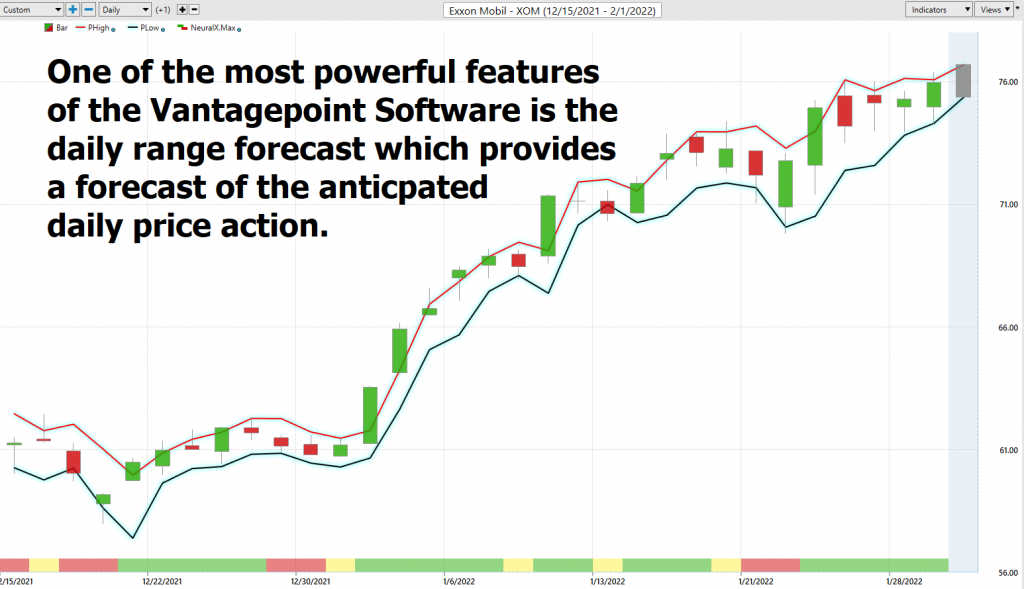
One of the powerful features in the Vantagepoint A.I. Software which Power Traders use daily is the Daily Price Range prediction forecast.
This forecast is what permits Power Traders to truly fine tune their entries and exits into the market.
What is the most important feature that traders are concerned about? Traders need to know where to enter and exit a market. VantagePoint provides this answer with exacting precision. Every day the Daily Range forecast is updated to provide insight to anticipated price action.
Intermarket Analysis
What makes the Vantagepoint Software really extraordinary is its capacity to perform Intermarket analysis and to find those assets which are most statistically interconnected and are the key drivers of price.
Studying the charts can always provide objective realities in terms of locating support and resistance levels which become very clear on a chart. But we live in a global marketplace. Everything is interconnected. The billion-dollar question for traders is always what are the key drivers of price for the underlying asset that I am trading?
These intangibles are invisible to the naked eye yet show very high statistical correlations.
Small changes in Interest rates, Crude Oil Prices, and the Volatility of the dollar amongst thousands of other variables affect the decisions companies must make to survive in these very challenging times. Trying to determine what these factors are is one of the huge problems facing investors and traders.
There is great value to be had in studying and understanding the key drivers of $XOM’s price action.
By doing so you can often see which ETFs are most likely acquiring $XOM as well as uncovering other industries which affect $XOM price movement.

This can be invaluable information because it allows a trader to locate other opportunities and see a listing of the ETF’s that are also buyers of $XOM. This knowledge is how other trading opportunities are often uncovered in their embryonic stages.
Suggestion
The trend is UP.
Momentum is UP. The stock is overvalued.
The reality that this stock has beat the performance of the S&P 500 by 270% is what keeps us super bullish on this asset The yield chase will move to higher performing assets and away from the Dow Industrials should the broader indexes continue to correct. We think this trend has started and will continue.
We like the idea of looking for buying opportunities of $XOM on dips and breaks which we expect to occur on a regular basis.
The predictive blue line is the guidance that we will be following. Wall Street Analysts are slowly revising their estimates upward.
Our advice: Follow the a.i. trend analysis and practice good money management on all your trades. The chart looks very strong on $XOM. Inflationary pressures accompanied by supply chain issues will be very supportive to higher crude oil prices.
We will re-evaluate this analysis based upon:
- Wall Street Analysts’ Estimates
- 52-week high and low boundaries
- Vantagepoint A.I. Forecast (Predictive Blue Line)
- Neural Network Forecast
- Daily Range Forecast
- Intermarket Analysis
Let’s Be Careful Out There!
Remember, It’s Not Magic.
It’s Machine Learning.

IMPORTANT NOTICE!
THERE IS SUBSTANTIAL RISK OF LOSS ASSOCIATED WITH TRADING. ONLY RISK CAPITAL SHOULD BE USED TO TRADE. TRADING STOCKS, FUTURES, OPTIONS, FOREX, AND ETFs IS NOT SUITABLE FOR EVERYONE.
DISCLAIMER: STOCKS, FUTURES, OPTIONS, ETFs AND CURRENCY TRADING ALL HAVE LARGE POTENTIAL REWARDS, BUT THEY ALSO HAVE LARGE POTENTIAL RISK. YOU MUST BE AWARE OF THE RISKS AND BE WILLING TO ACCEPT THEM IN ORDER TO INVEST IN THESE MARKETS. DON’T TRADE WITH MONEY YOU CAN’T AFFORD TO LOSE. THIS ARTICLE AND WEBSITE IS NEITHER A SOLICITATION NOR AN OFFER TO BUY/SELL FUTURES, OPTIONS, STOCKS, OR CURRENCIES. NO REPRESENTATION IS BEING MADE THAT ANY ACCOUNT WILL OR IS LIKELY TO ACHIEVE PROFITS OR LOSSES SIMILAR TO THOSE DISCUSSED ON THIS ARTICLE OR WEBSITE. THE PAST PERFORMANCE OF ANY TRADING SYSTEM OR METHODOLOGY IS NOT NECESSARILY INDICATIVE OF FUTURE RESULTS. CFTC RULE 4.41 – HYPOTHETICAL OR SIMULATED PERFORMANCE RESULTS HAVE CERTAIN LIMITATIONS. UNLIKE AN ACTUAL PERFORMANCE RECORD, SIMULATED RESULTS DO NOT REPRESENT ACTUAL TRADING. ALSO, SINCE THE TRADES HAVE NOT BEEN EXECUTED, THE RESULTS MAY HAVE UNDER-OR-OVER COMPENSATED FOR THE IMPACT, IF ANY, OF CERTAIN MARKET FACTORS, SUCH AS LACK OF LIQUIDITY. SIMULATED TRADING PROGRAMS IN GENERAL ARE ALSO SUBJECT TO THE FACT THAT THEY ARE DESIGNED WITH THE BENEFIT OF HINDSIGHT. NO REPRESENTATION IS BEING MADE THAT ANY ACCOUNT WILL OR IS LIKELY TO ACHIEVE PROFIT OR LOSSES SIMILAR TO THOSE SHOWN.

