
To begin this stock study we want to share with you a chart that Power Traders have been focused on over the past month, Tencent Music Entertainment ($TME). It’s an example of incredible price movement tracked very effectively by artificial intelligence. Observe what has occurred in the last 24 trading sessions as $TME bounced off its 52-week lows. We share this chart with you today because we feel these kinds of rallies will become more commonplace in the months and weeks ahead across different asset classes which have been severely beaten up.
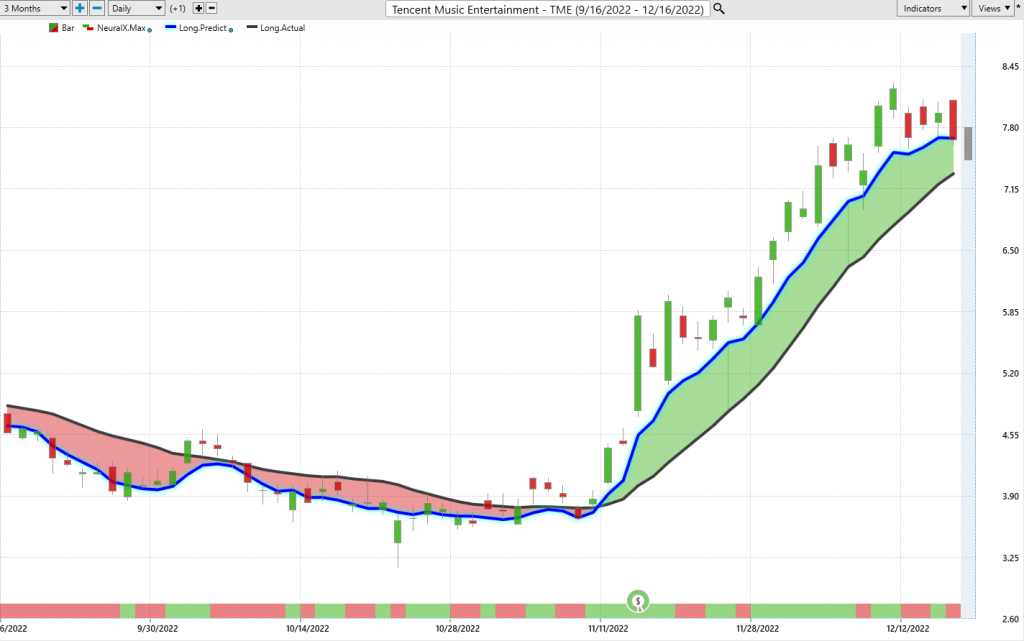
$TME has rallied 74% in the last 24 trading sessions. We noticed it had held its 52-week lows and have been watching it with great interest as the a.i. forecast alerted us that the downtrend had come to an end.
Today we are doing a deep dive on LYFT.
Founded in 2012, LYFT Inc. (NYSE: LYFT) is a dominant ride-share company whose technology platform connects drivers and riders through their smartphone applications. They have an estimated 1 million drivers around the United States, many of whom work part-time. The founders are Logan Green and John Zimmer, who sought to revolutionize on-demand transportation with a vision of improving people’s lives and creating economic opportunities in cities throughout America. Some of their main competitors include Uber, which is the leader of worldwide ride-share service, as well as Juno and Gett Taxi – both of which offer users clear pricing options for zone-based ridesharing services.
The business model of companies like UBER and LYFT has seen tremendous growth over the past few years, but they still face some considerable challenges. The two biggest ones probably involve regulation and worker rights. As ‘gig economy’ behemoths, these companies do not offer traditional employment status to their drivers, meaning they are exempt from certain regulations that apply to conventional employers. This can make it difficult for the companies to operate in certain markets and jurisdictions where labor regulations are particularly stringent. In addition, those same regulatory exemptions mean drivers lack certain benefits such as health insurance that many traditional employees take for granted. Therefore, although UBER and LYFT have found success with their business model, they still must contend with important challenges when dealing with regulation and worker rights.
At present, investors have several serious concerns about investments in companies such as LYFT. The first is the lack of clear long-term business models; both companies’ focus on ridesharing has meant that they are not currently capable of generating stable profits, leaving long-term sustainability an unknown quantity. Additionally, the uncertain regulatory landscape surrounding these companies adds another layer of unpredictability to the situation; while many areas have passed laws permitting ridesharing services to operate legally, other places are still catching up. Finally, investors must factor in the potential for competition with other firms that could challenge these businesses’ market share and pricing restrictions. As such, there is significant risk involved any time an investor contemplates entering the market for stocks related to LYFT.
On the positive side, Earnings for LYFT have grown by 7.7% per year over the last 5 years. Revenue is forecasted to grow by 13.3% per year. But despite these very optimistic earnings and revenue forecasts, the company is not forecasted to become profitable over the next three years. The share price of LYFT has been exceptionally volatile and more importantly, shareholders have been diluted over the past year with LYFT stock. Dilution of shareholder value occurs when management, for a variety of reasons, issues additional equity to the existing shareholders. This can be done in the form of a rights offering, issuing stock via a stock option plan, increasing the number of authorized shares or through acquisitions among other methods. As a result, each existing equity holder owns a smaller portion of the total outstanding shares and is considered “diluted”. Companies practice dilution as it can bring additional capital into the business without having to take on heavy borrowing from banks or financial institutions. Additionally, by diluting shares it may incentivize certain parties who have contributed capital to maintain their current level of investments and remain involved with the organization long-term. Dilution is thus one-way companies seek to raise funding while simultaneously trying to secure full engagement from stakeholders.
In this weekly stock study, we will look at and analyze the following indicators and metrics as are our guidelines which dictate our behavior in deciding whether to buy, sell, or stand aside on a particular stock.
- Wall Street Analysts’ Estimates
- 52-week high and low boundaries
- Best Case – Worst Case Analysis and Takeaways
- Vantagepoint A.I. Forecast (Predictive Blue Line)
- Neural Network Forecast
- Daily Range Forecast
- Intermarket Analysis
- Our trading suggestion
We don’t base our trading decisions on things like earnings or fundamental cash flow valuations. However, we do look at them to better understand the financial landscape that a company is operating under.
Wall Street Analysts’ Estimates
The 34 analysts offering 12-month price forecasts for Lyft Inc have a median target of 18.50, with a high estimate of 45.00 and a low estimate of 11.00. The median estimate represents a +66.29% increase from the last price of 11.13.
From this simple information we can determine two especially important things:
- There is a strong divergence of opinion.
- The broad consensus of analysts agrees that $LYFT is undervalued at current levels by 66% of what they consider to be its long-term fair market value.
When you put these all together it is a recipe for great volatility.
52-Week High and Low Boundaries
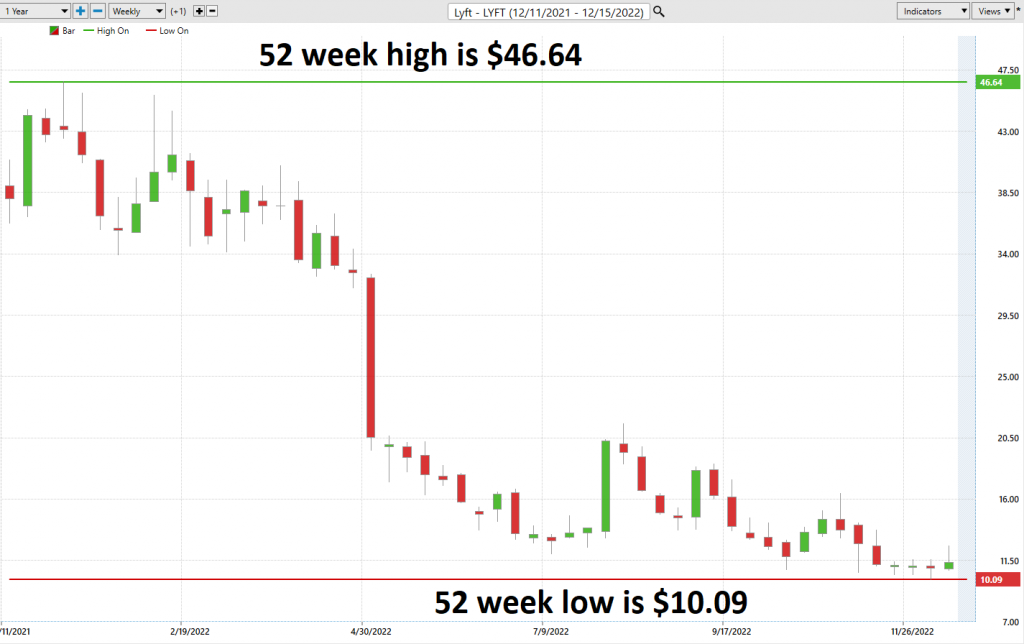
Looking at the Long-Term chart of $LYFT provides us with the 52-week high and low boundaries.
Over the past year we have seen $$LYFT trade as low as $10.09 and as high as $46.64. The annual trading range has been $36.55.
Currently, the stock has been trading at its 3rd percentile of the last 52 weeks’ range.
What we would also like to do is to divide the current price by the annual trading range to get a measure of annualized volatility. This metric tells us what we can expect over the next 12 months should it be like the last 12 months. Currently, the annualized volatility in $LYFT is 322% which is amongst the highest statistical volatilities we ever encounter.
Simply looking at the chart you can see the volatile journey it has been on.
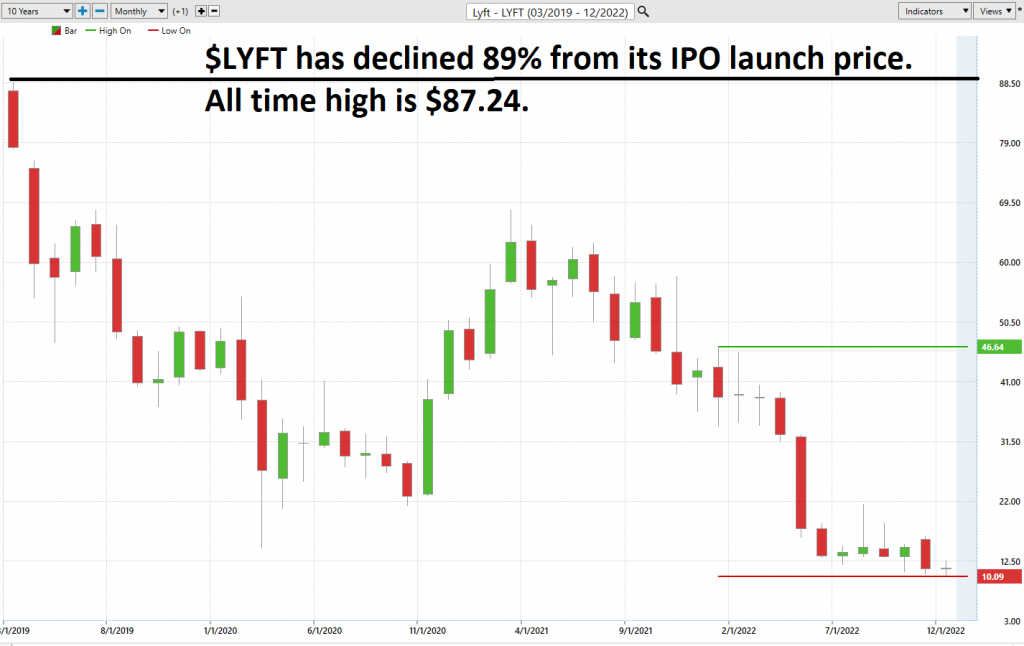
This journey is further exaggerated when we study the chart from the moment the stock went public. On March 29, 2019, LYFT ($LYFT) went public with a market valuation of approximately $24 billion. Prior to its Initial Public Offering (IPO), the ride-hailing company had established itself as the second largest player in the U.S., next to its rival Uber. The move proved beneficial for the company’s long-term growth given that its IPO initially priced at $72 per share was much higher than initially expected, allowing it to raise more than $2 billion. Even though investors have been uncertain about LYFT’s resistance to competition and escalating expenses due to its high losses, they were nonetheless encouraged by the high demand of their IPO shares.
By doing so we can see and determine that the stock rallies upon going public and posted its all-time high at $87.24. Over the last 3 years the stock has slid 89% from its all-time high.
Best Case – Worst Case Scenario
When we study the long-term 52-week chart we can look at the best case and worst-case scenarios just to get an eyeball perspective of the risk and volatility of this asset. This is worth doing anytime you invest or trade to monetarily understand what the potential risks and rewards have been over the past year. All that we are looking to analyze is the distance and speed between highs and lows over a given year.
It is worth doing this type of baseline analysis because it allows you to visually ascertain how quickly a stock drops in comparison to the speed with which it moves higher.
First, we do the Best-Case analysis:
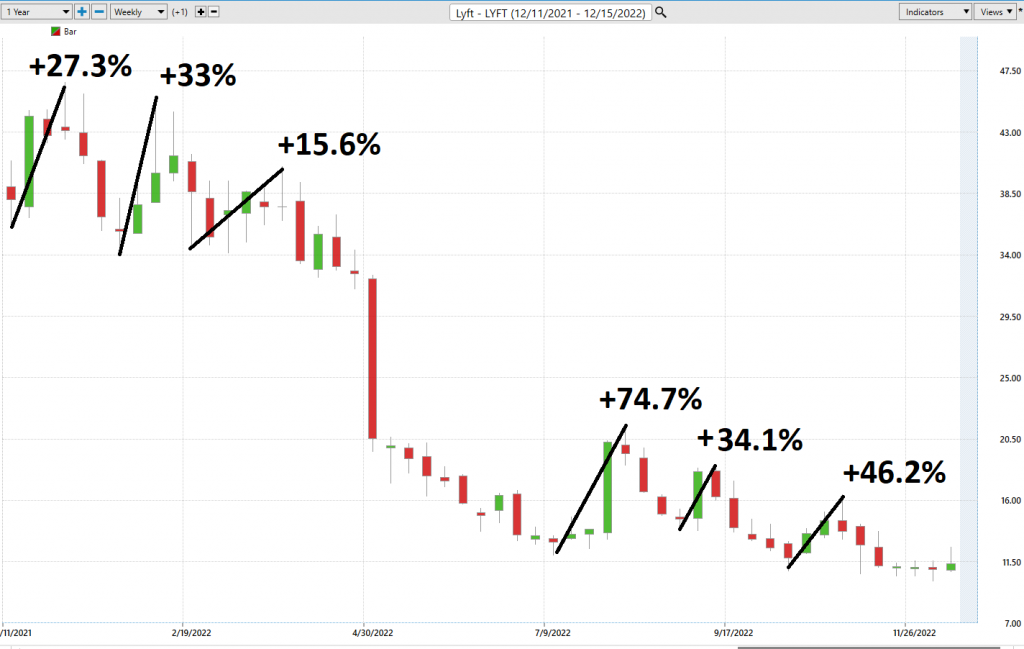
Followed by the WORST-CASE Analysis:
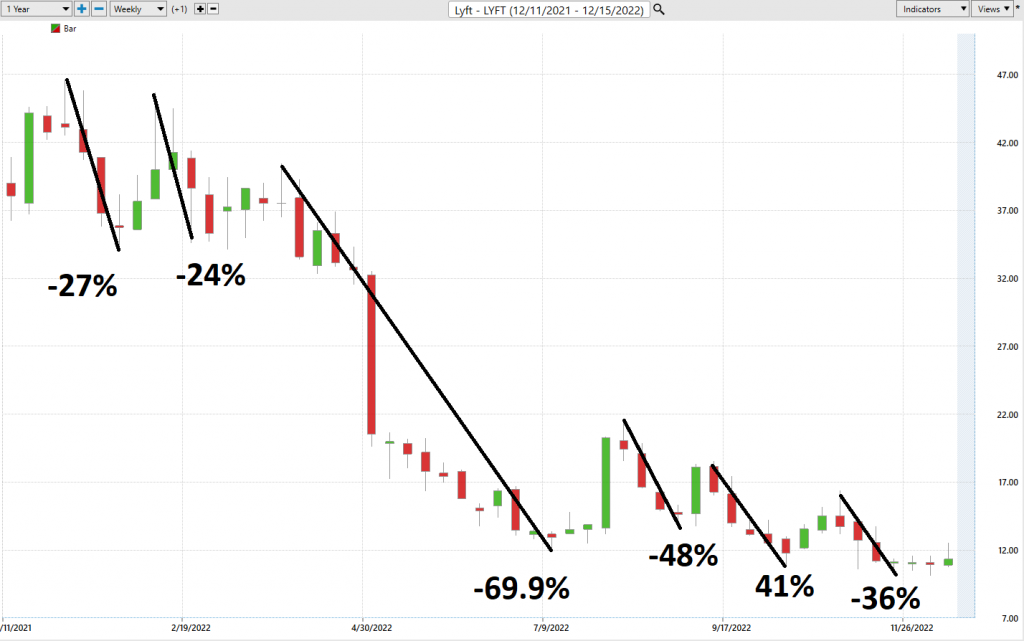
This initial analysis lets us see how quickly $LYFT falls in comparison to its rallies. In this regard, we can quickly see that the declines for the most part are substantially larger than the rallies.
Next, we want to compare the performance of $LYFT to the major broad market indexes.
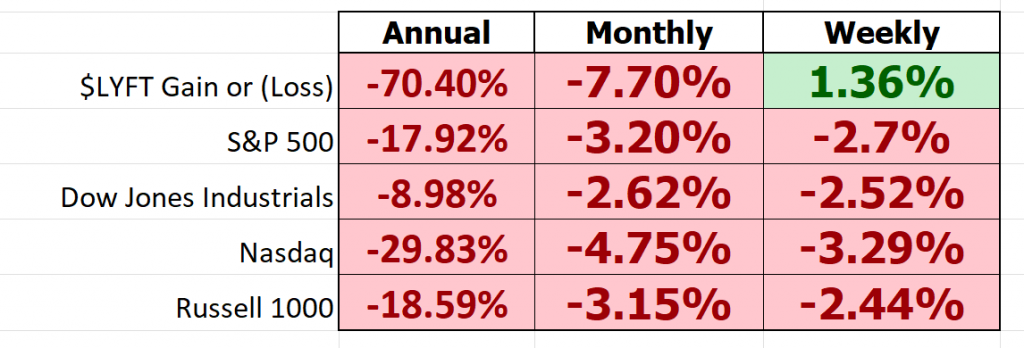
So, in $LYFT we have an asset which is much more volatile than the broader market and has massively underperformed the broader market. We are examining it closely here in this stock study primarily because it rallied sharply off its 52-week low and the a.i. had forecasted a short-term uptrend.
Earnings dates have also been a key driver in $LYFT price action. The next $LYFT earnings call is slated for February 14, 2023.
Vantagepoint A.I. Forecast (Predictive Blue Line)
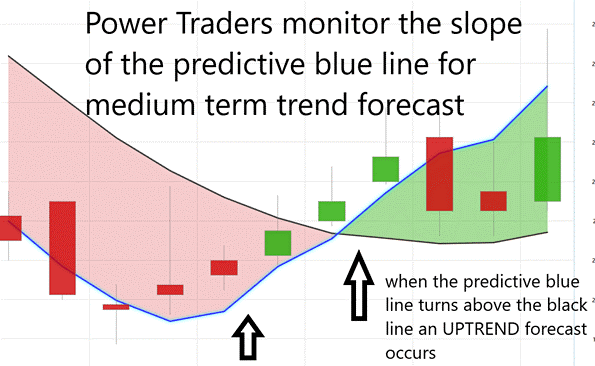
On the following chart you will see the power of the VantagePoint Predictive blue line which determines the medium-term trend price forecast.
The guidelines we abide by are as follows:
- The slope of the predictive blue line determines the trend forecast and general direction of $LYFT
- Ideally, the VALUE ZONE is determined to try and find buy opportunities at or below the predictive blue line, or to sell opportunities above the predictive blue line during a downtrend.
Naturally when the predictive blue line slopes lower traders would be anticipating lower prices and either moving to the sidelines or hedging their positions.
Using VantagePoint Software and our artificial intelligence, traders are alerted to trend forecasts by monitoring the slope of the predictive blue line.
The predictive blue line, however, utilizes the VantagePoint-patented Neural Network and Intermarket Analysis to arrive at its value. It looks at the strongest price drivers of an asset through artificial intelligence and statistical correlations to determine its value.
What is fascinating about the chart is that by simply estimating the chart we can see that the slope of the predictive blue line is like the NORTH STAR in providing directional guidance to traders. In other words, don’t fight the trend. The trading opportunities might last a few days or several weeks, but the focus is always to keep the trader on the right side of the right trend at the right time. The blue line ALWAYS determines the forecast and the best move forward.
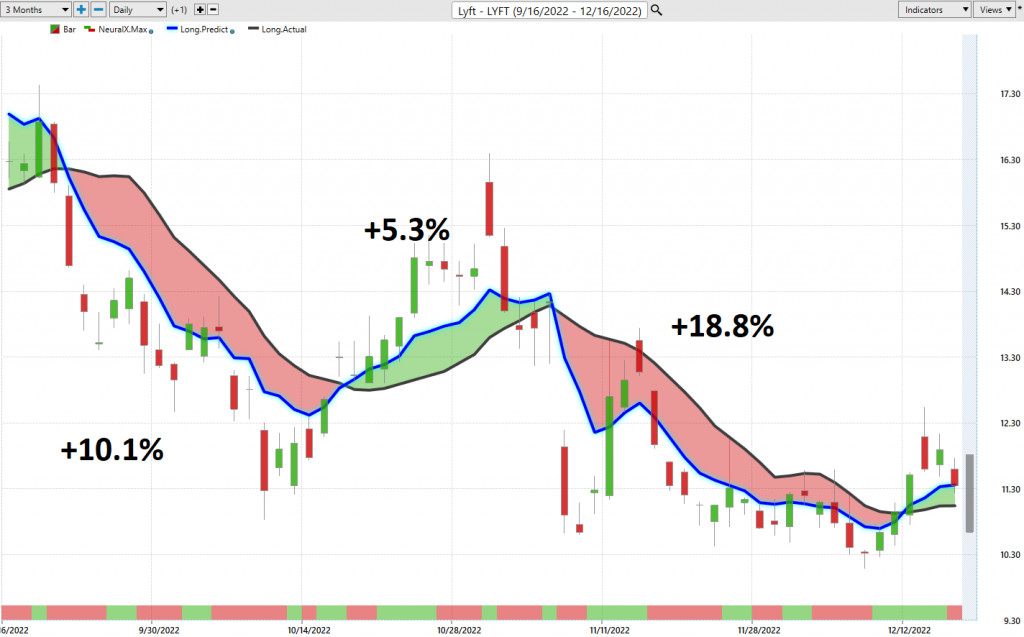
Over the last 3 months, there have been three separate a.i. trend forecasts for cumulative gains of 34.2%. Most of these gains have been on the short side of the market.
Neural Network Indicator (Machine Learning)
At the bottom of the chart is the Neural Network Indicator which predicts future short-term strength and/or weakness in the market. When the Neural Net Indicator is green it communicates strength. When the Neural Net is Red it is forecasting short term weakness in the market.
A Neural Net is a computational learning system that uses a network of functions to understand and translate massive amounts of data into a desired output, consistently monitoring itself and improving its performance. A neural network in trading is a type of artificial intelligence system that uses algorithms to learn patterns in financial markets and make predictions about future market behavior. To establish a neural network, traders must feed historical data into the algorithm so it can recognize predictable trends. Neural networks are then used to analyze large amounts of data quickly so that traders can identify attractive trading opportunities faster than manual analysis. This can give traders a distinct advantage over those not using these systems, as they have access to more precise market insights and opportunities with deeper analysis. Furthermore, neural networks can detect subtle variations in behavior that may be missed by human analysts due to their sheer speed and accuracy in evaluating markets.
Neural Networks are essentially trainable algorithms that emulate aspects of the human brain. This means they can be trained based upon criteria for assessing risk and potential reward to determine the best move forward. This allows them to make high probability forecasts based on available historical information.
We advocate that Power Traders cross reference the chart with the predictive blue line and neural network indicator to create optimal entry and exit points.
For the serious trader, neural networks are a next-generation trading tool that can detect subtle non-linear interdependencies and patterns that traditional methods of technical analysis are unable to uncover.
Traders look for confirmation on Neural Net to position themselves LONG or SHORT in the market. In other words, when the A.I. forecast is green, and The Neural Net is green, that presents a buying opportunity.
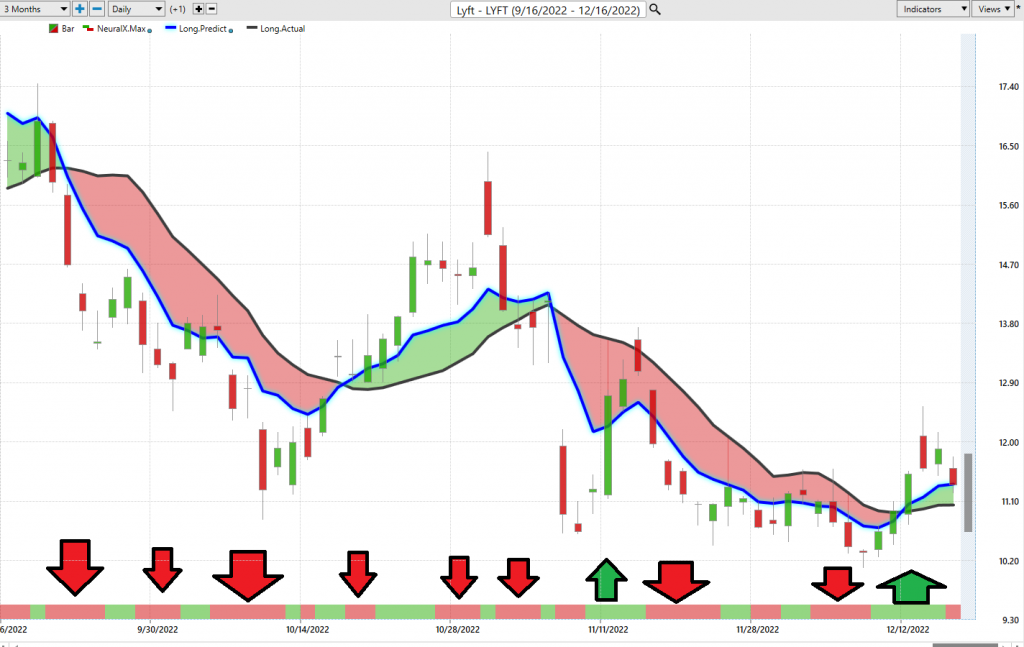
The inverse is also true, when the A.I. forecast is red and the Neural Net is red, that is a selling opportunity. The arrows on the chart below highlight the trading zones where Power Traders would’ve been using double confirmation to BUY in cross referencing the A.I. forecast with the Neural Net.
The arrows on the chart are the moments when the a.i. and the neural index were both pointing in the same direction.
Power Traders are always looking to apply both the Neural Network and A.I. to the markets to find statistically sound trading opportunities.
VantagePoint Software Daily Price Range Prediction
We will zoom in in on the last 1 month of price action so that you can see for yourself how the a.i. and machine learning combine to create a very accurate daily price range forecast that keeps traders focused on optimal trade placement.
One of the powerful features in the VantagePoint Software which Power Traders use daily is the Price Range prediction forecast.
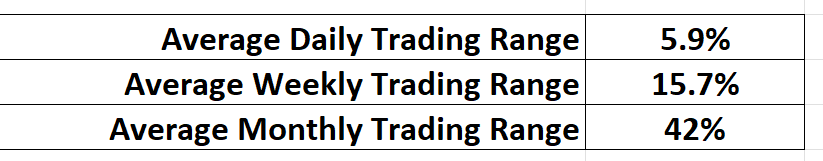
Here are the broad range of trading metrics over the past year.

These metrics tell you statistically what has occurred. What traders must always do is determine how to put this knowledge into action.
With volatility comes either huge opportunity or risk.
Volatility, opportunity, and risk are three concepts that are intertwined with one another. Volatility is a measure of the price variation of an asset over time, which can be seen as the potential for gain or loss in the value of a trade. Opportunity, on the other hand, arises when volatility offers traders the chance to take advantage of seemingly profitable divergences.
A stock like LYFT has an average weekly trading range of 15.7% and a monthly average trading range of 42%. We know there is opportunity for profit but first we have to manage and understand the risk involved.
The Vantagepoint A.I. daily range forecast is what permits Power Traders to truly fine tune their entries and exits into the market.
Every day traders are faced with the anxiety and frustration of wondering where they should be looking to buy and sell the market. VantagePoint’s A.I. makes this decision super easy with the Daily Price Range Forecast.
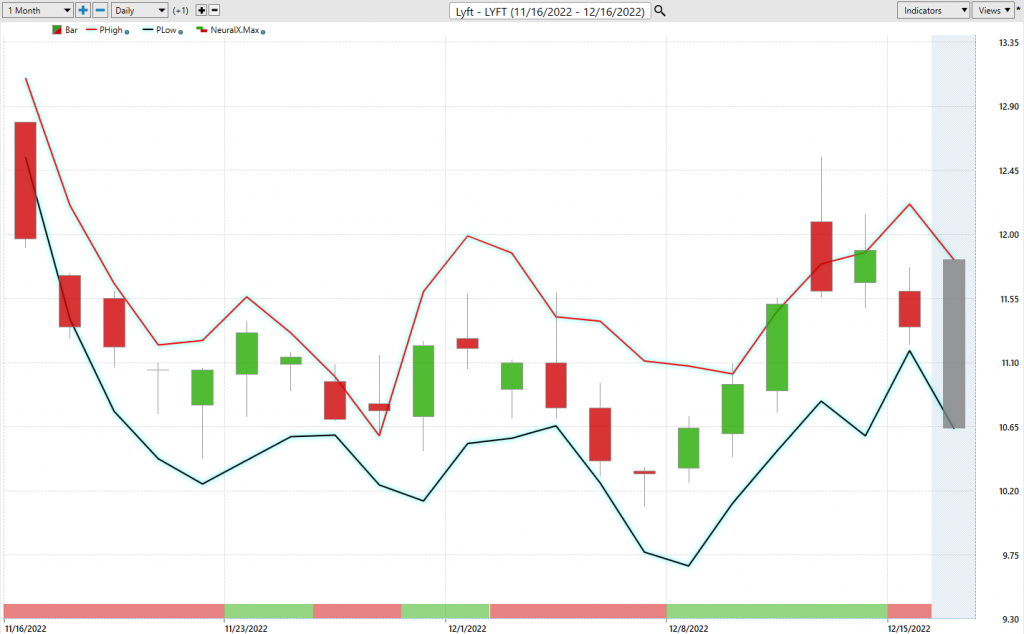
This chart helps traders decide where stop placement should occur. Observing how placing protective sell stops below the dark line on the chart was a powerful way to minimize risk on this trade.
See how the upper and lower bands of the price range forecast for a clear channel of trading activity as well. Swing traders are always looking for buying opportunities towards the bottom of the predicted channel and try to find selling opportunities above the top band.
Intermarket Analysis
Power lies in the way we respond to the truth we understand.
One of the supremely important questions in trading is what is driving the price? Headlines often create interesting narratives. But these “stories” only capture the imagination. Traders want and need to understand the cause and effect of price movement.
The only way to get an answer to this important question is through intermarket analysis which looks at statistical price correlations of assets.
We live in a global marketplace.
Everything is interconnected.
Analyzing intermarket relationships is a complex process that leaves no stone unturned.
Intermarket analysis is a trading strategy used to predict future prices by looking at correlations between various markets. It involves examining the relationships between different asset classes such as stocks, commodities, currencies, and bonds. Traders believe that it provides them with improved insight into potential prices movements because these markets act upon each other’s influence at times. Leading practitioners of Intermarket analysis are typically seasoned traders with experience in many markets around the world. By utilizing this type of analysis, they can capture better profit opportunities while minimizing losses. By studying and practicing Intermarket analysis, traders can learn how to identify turning points and trends before they occur in the market. This knowledge can be a powerful asset for capturing profits more regularly.
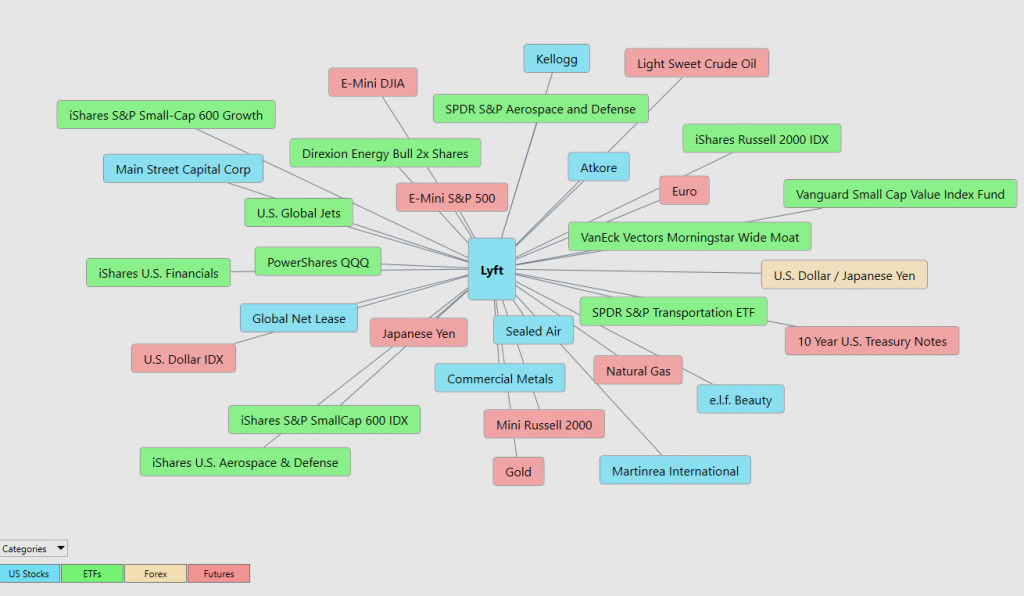
Interest rates, Crude Oil Prices, and the volatility of the Dollar amongst thousands of other variables affect the decisions companies must make to flourish and prosper in these particularly challenging times. Trying to determine what these factors are is one of the huge problems facing investors and traders.
You always have a choice. You can tune in to the talking heads in the media who spin talking points which promote fear. Or you can rely on facts to base your decision making on.
Within the Intermarket Analysis graphic, you will see the 31 markets that are the key drivers to $LYFT’s price.
There is great value to be had in studying and understanding the key drivers of $LYFT’s price action.
Trading Suggestion
It can be difficult to determine an exact number of private ridesharing companies operating in the United States due to the highly fragmented nature of the industry and its many players. However, research into the available data suggests that there are currently at least two dozen major companies providing ridesharing services across all states, with smaller players also having a significant presence in certain parts of the country. Ride-sharing services have grown exponentially within the last decade and show no signs of slowing down – a stark reminder of just how profoundly technology has impacted the transportation industry.
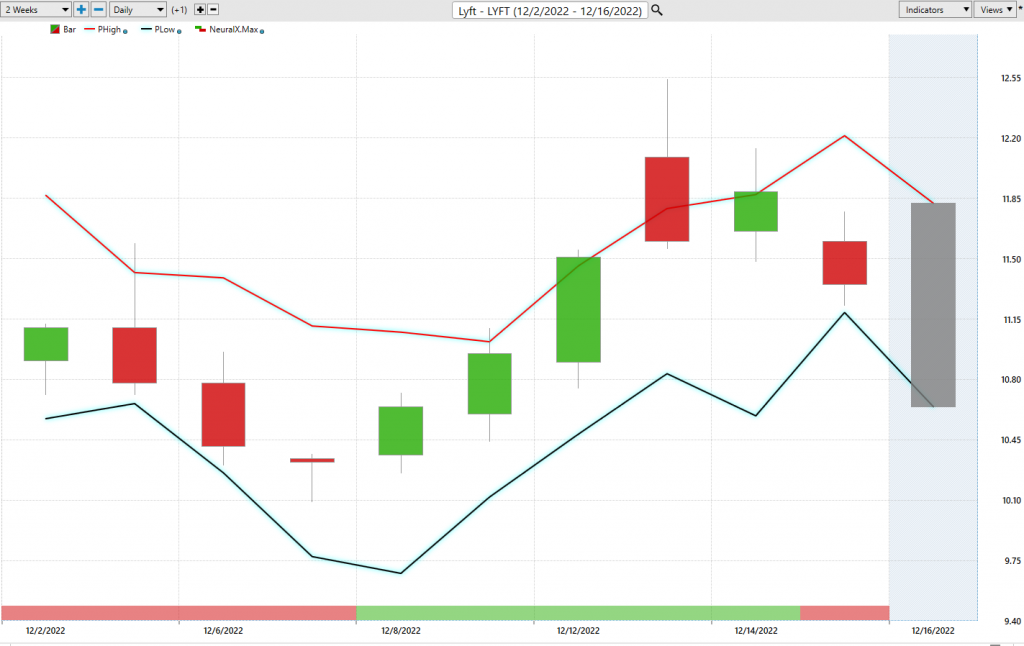
Using the Vantagepoint Software I can zoom in on this time frame and view the artificial intelligence and Neural Net forecast which confirms the predictive trend analysis.
We think $LYFT is a trading vehicle for short term swing trades. It has been massively oversold. The rallies were short lived.
Will will continue to use the VantagePoint Daily Range Forecast to look for short term positioning opportunities on the long side.
With the average daily trading range being 5.9% there is ample opportunity for quick, short-term swing trades.
We advise that you always practice solid money management in your trading and always trade small with an asset that is this exceptionally volatile.
Our explanation for its recent price action is that it has been one of the most beaten-up stocks of the past year. It solidly held its 52-week low and upon doing though it attracted value traders and investors looking for a quick rebound.
When we focus on the statistical averages on the daily, weekly, and monthly time frames there is massive opportunity, but it is accompanied by greater than normal risk.
We urge Power Traders to pay attention to two facts.
As of this writing, $LYFT is not profitable.
Wall Street Analysts believe the stock is 66% undervalued from its current price level.
Our recommendation is to follow the A.I. trend analysis as outlined in this stock study and practice good money management on all trades.
We will re-evaluate daily based upon:
- New Wall Street Analysts’ Estimates
- New 52-week high and low boundaries
- Vantagepoint A.I. Forecast (Predictive Blue Line)
- Neural Network Forecast
- Daily Range Forecast
The short trend in $LYFT is UP. We expect the 52-week low to provide long-term supprt.
Let’s Be Careful Out There!
Remember, It’s Not Magic.
It’s Machine Learning.

IMPORTANT NOTICE!
THERE IS SUBSTANTIAL RISK OF LOSS ASSOCIATED WITH TRADING. ONLY RISK CAPITAL SHOULD BE USED TO TRADE. TRADING STOCKS, FUTURES, OPTIONS, FOREX, AND ETFs IS NOT SUITABLE FOR EVERYONE.
DISCLAIMER: STOCKS, FUTURES, OPTIONS, ETFs AND CURRENCY TRADING ALL HAVE LARGE POTENTIAL REWARDS, BUT THEY ALSO HAVE LARGE POTENTIAL RISK. YOU MUST BE AWARE OF THE RISKS AND BE WILLING TO ACCEPT THEM IN ORDER TO INVEST IN THESE MARKETS. DON’T TRADE WITH MONEY YOU CAN’T AFFORD TO LOSE. THIS ARTICLE AND WEBSITE IS NEITHER A SOLICITATION NOR AN OFFER TO BUY/SELL FUTURES, OPTIONS, STOCKS, OR CURRENCIES. NO REPRESENTATION IS BEING MADE THAT ANY ACCOUNT WILL OR IS LIKELY TO ACHIEVE PROFITS OR LOSSES SIMILAR TO THOSE DISCUSSED ON THIS ARTICLE OR WEBSITE. THE PAST PERFORMANCE OF ANY TRADING SYSTEM OR METHODOLOGY IS NOT NECESSARILY INDICATIVE OF FUTURE RESULTS. CFTC RULE 4.41 – HYPOTHETICAL OR SIMULATED PERFORMANCE RESULTS HAVE CERTAIN LIMITATIONS. UNLIKE AN ACTUAL PERFORMANCE RECORD, SIMULATED RESULTS DO NOT REPRESENT ACTUAL TRADING. ALSO, SINCE THE TRADES HAVE NOT BEEN EXECUTED, THE RESULTS MAY HAVE UNDER-OR-OVER COMPENSATED FOR THE IMPACT, IF ANY, OF CERTAIN MARKET FACTORS, SUCH AS LACK OF LIQUIDITY. SIMULATED TRADING PROGRAMS IN GENERAL ARE ALSO SUBJECT TO THE FACT THAT THEY ARE DESIGNED WITH THE BENEFIT OF HINDSIGHT. NO REPRESENTATION IS BEING MADE THAT ANY ACCOUNT WILL OR IS LIKELY TO ACHIEVE PROFIT OR LOSSES SIMILAR TO THOSE SHOWN.

