
![]()
McCormick and Co ($MKC) is a global leader in the manufacture, marketing, and distribution of spices, seasoning mixes, condiments, and other flavorful products. Here are some important company highlights:
- Founded by Willoughby M. McCormick in 1889 in Baltimore, Maryland, United States.
- As of 2021, the company has over 14,000 employees worldwide.
- McCormick and Co went public in 1925 and is listed on the New York Stock Exchange (NYSE).
- The company is headquartered in Hunt Valley, Maryland, United States.
- McCormick and Co own several brands, including McCormick, Old Bay, Frank’s RedHot, Lawry’s, Zatarain’s, Thai Kitchen, and Simply Asia, among others.
- The company manufactures over 10,000 products in 150 countries around the world.
In recent years, McCormick and Co has been focused on expanding its product offerings, increasing its global reach, and pursuing strategic acquisitions. The company has also been committed to sustainability and reducing its environmental impact, with goals to reduce greenhouse gas emissions, water usage, and waste.
2022 was a difficult year for the spices and flavoring manufacturer. McCormick’s recent challenges include exiting a low-margin business in India, pulling out of Russia due to geopolitical tensions, and experiencing COVID-19 lockdowns in China, the company’s second-largest market. Despite these challenges, McCormick’s revenue has grown at a compounded annual growth rate of 7% compared to 2019. Despite all of these massive issues the company still outperformed the S&P 500 Index. Veteran investors believe that the company held up exceptionally well with this onslaught of negative events. Over the last 15 years $MKC has been a super alpha stock as its cumulative performance has dominated surpassed the S&P 500 by over 350%!
Despite the double-digit percentage drop in the company’s stock value, this decline created an attractive buying opportunity for investors. McCormick is well-positioned in the spice, sauce, and flavorings market and has a loyal customer base. Even though sales trends look weaker than in previous years, the company has a solid track record of growth and expects to rebound in the coming year.
$MKC earnings are forecasted to grow by 9.9% per year.
$MKC pays a solid dividend of 1.81% per year.
Investors should remain bullish about McCormick’s future. Home-cooked meals have become more popular and economical due to the pandemic, making McCormick’s products essential for adding flavor to meals. While economic indicators are mixed, McCormick’s long-term growth potential makes it an attractive investment option.

In this weekly stock study, we will look at and analyze the following indicators and metrics as our guidelines:
- Wall Street Analysts’ Estimates
- 52-week high and low boundaries
- Vantagepoint A.I. Forecast (Predictive Blue Line)
- Neural Network Forecast
- Daily Range Forecast
- Intermarket Analysis
- Our trading suggestion
We only look at things like earnings or fundamental cash flow valuations to better understand the financial landscape that a company is operating under. Our trading approach and only loyalty is to the trend as dictated by the artificial intelligence, neural networks, and intermarket analysis.
Analysts Ratings
The 12 analysts offering 12-month price forecasts for McCormick & Company Inc have a median target of 76.00, with a high estimate of 97.00 and a low estimate of 64.00. The median estimate represents a -11.75% decrease from the last price of 86.12.
The next scheduled earnings release for $MKC is on July 5, 2023.
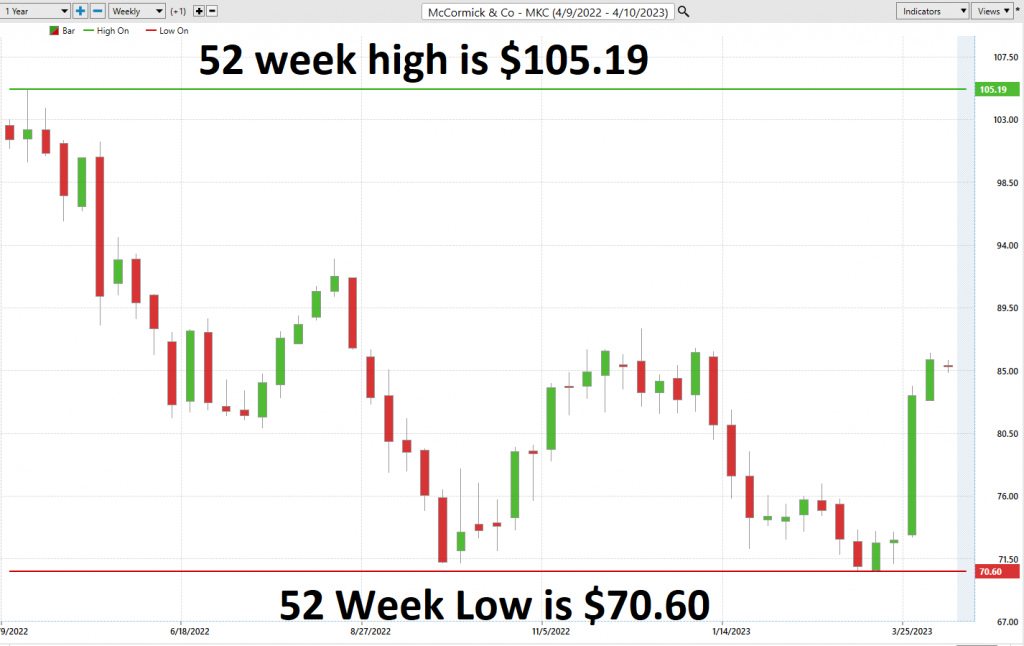
52-week High-Low Chart
Over the last 52 weeks $MKC has traded as high as $105.19 and as low as $70.60. This provides us with an annual trading range of $34.59. What we often like to do as well is divide the annual trading range by the current price ($86.11) to provide us with a very basic and generic calculation of how the annualized volatility for $MKC, which is currently 40.2%. This metric tells us that based upon the last 12 months we could potentially expect $MKC to trade as much as 40.2% higher and/or lower than its current price. $MKC is currently trading at the 45th percentile of its 52-week range.
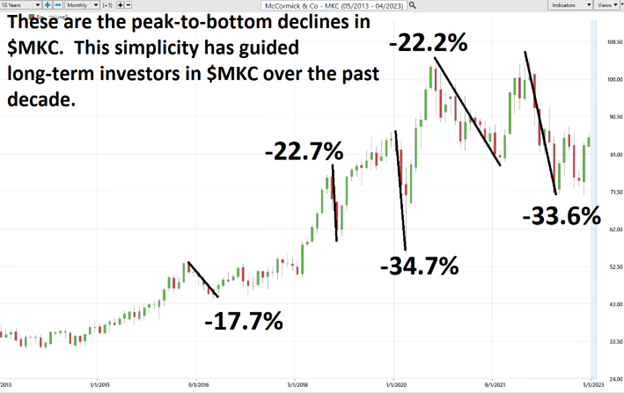
When we zoom in on the 10-year long term chart we can also glean some important insights regarding risk and opportunity. There have been 5 significant declines peak to bottom in $MKC over the past 10 years. The smallest has been -17.7% and the largest has been 34.7%. The average decline has been roughly 26%. Long term investors have used this simplicity in looking for entries into $MKC which has been a Wall Street darling and outperformed the S&P 500 over the past decade.
Best Case – Worst Case Scenarios
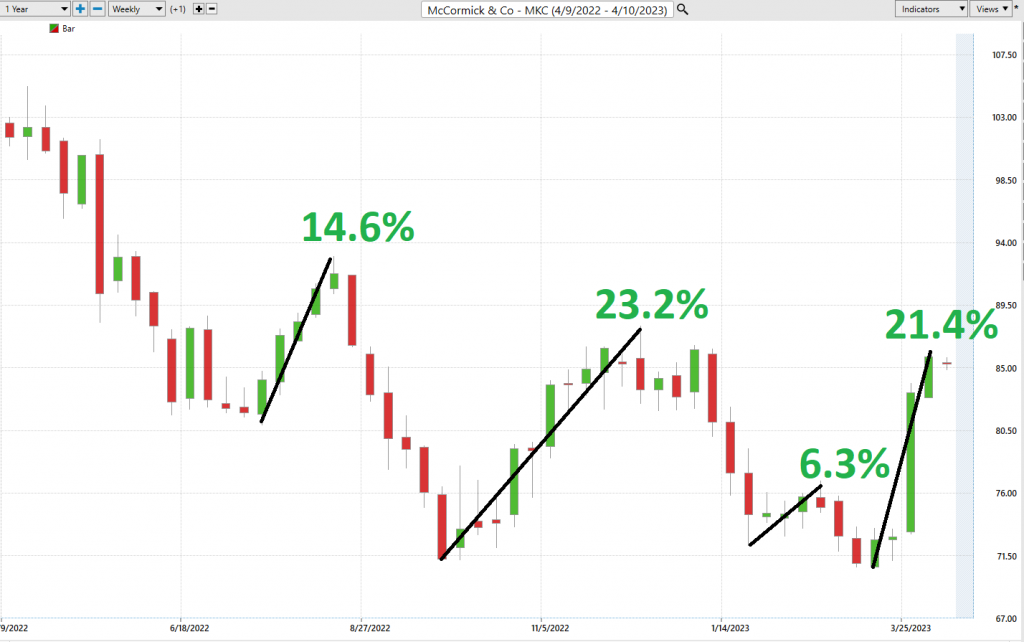
We like looking at MKC rallies and declines over the last year to get a clear picture of how $MKC has behaved.
Even though last year was a down year for $MKC you can quickly eyeball rallies against declines to get a solid representative view of volatility.
Here is the best-case scenario:
Followed by the worst-case scenario:
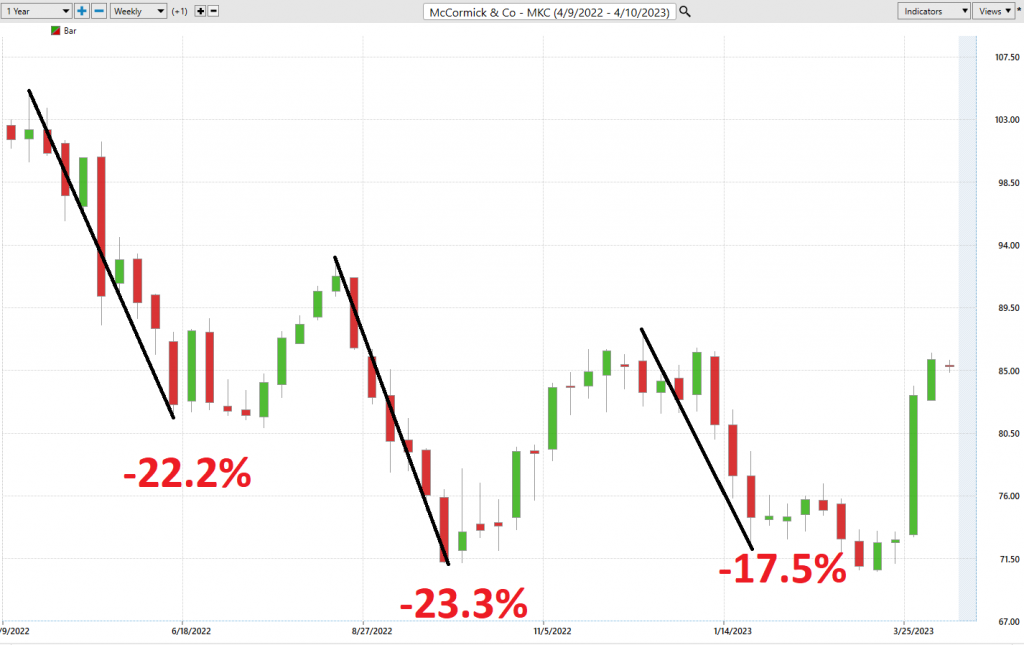
When we study the long-term 52-week chart we can look at the best case and worst-case scenarios just to get an eyeball perspective of the risk and volatility of this asset. This is worth doing anytime you invest or trade to monetarily understand what the potential risks and rewards have been over the past year.
This simple practical analysis reveals what realistic volatility is, and places those values on the chart and allows you to see the time duration for the corresponding gains or losses.
Next, we compare $MKC to the broader stock market indexes to get an idea of its relative performance.
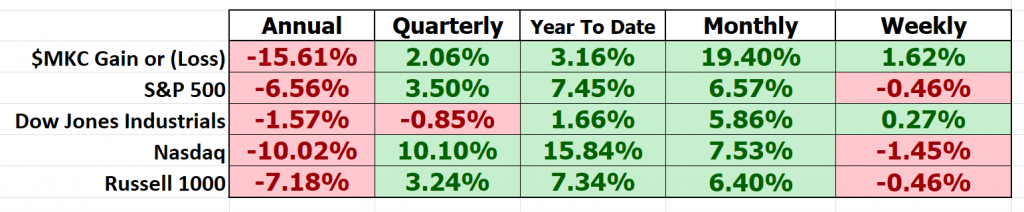
Over the last year $MKC underperformed all of the broader stock indexes. This is primarily due to it shutting down its India operations, pulling out of Russia and been locked out of China throughout much of 2022.
What we can learn from this simple analysis is that investors in $MKC have had to take a tremendous amount of price risk over the past two years to capture their 1.8% dividend. Since we are short-term traders, this verifies for us our very short-term time horizon on our trading decisions and allows us to focus on a short-term trend channel to position ourselves accordingly for smaller short-term gains.
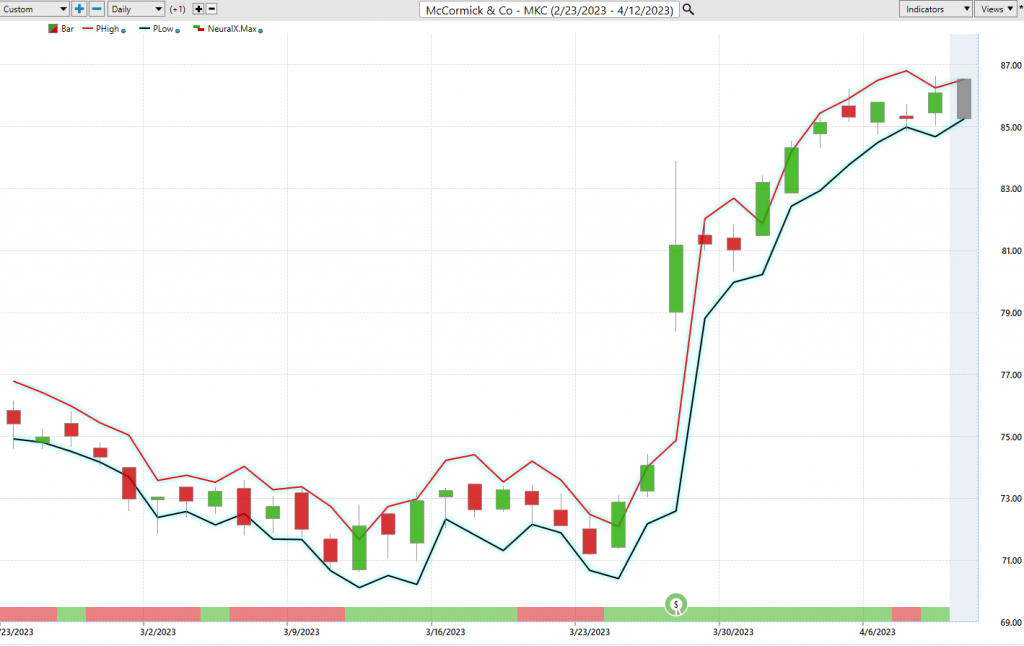
The Vantagepoint A.I. Analysis
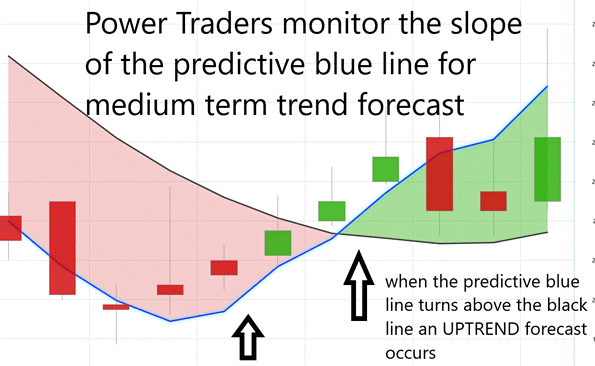
When analyzing the chart below, pay close attention to the slope of the blue line. This predictive blue line utilizes Vantagepoint’s patented Neural Network and Intermarket Analysis to determine its value. By examining the strongest price drivers of an asset through artificial intelligence and statistical correlations, the blue line can identify price trends.
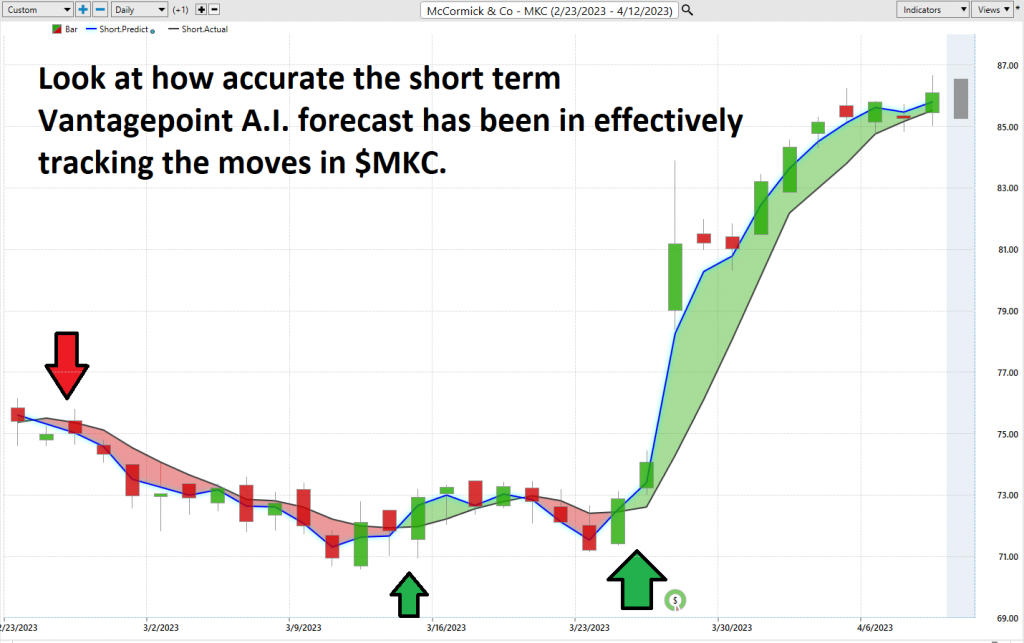
By examining the last few months of price action in $MKC, we can harness the power of artificial intelligence to better understand the stock’s behavior. The slope of the predictive blue line is the key factor in determining the price trend.
Experienced traders can use the predictive blue line to identify the value zone and trend direction. Two consecutive closes above the predictive blue line define where an uptrend forecast occurs. When the slope of the predictive blue line turns higher, it indicates that a change in price direction is imminent. A strong trend is evidenced by consistent prices closing above the predictive blue line, as observed in the chart.
In summary, the slope of the predictive blue line is a powerful tool for identifying trends in $MKC and can help traders make informed decisions about when to buy or sell.
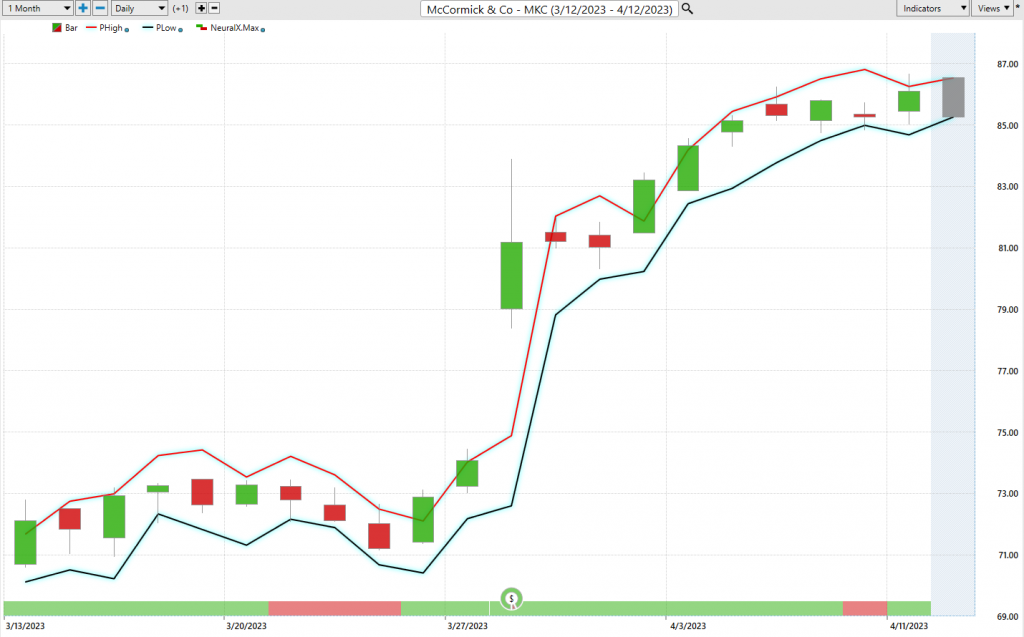
Fine Tuning Entries with The Neural Net Indicator
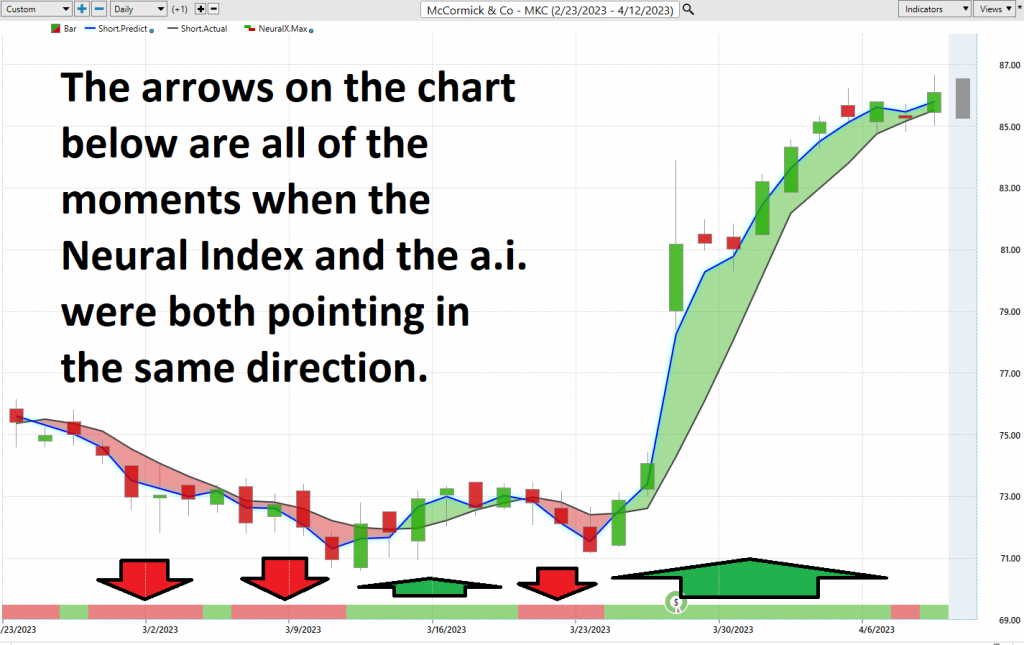
The chart features a Neural Network Indicator at the bottom, which predicts future market strength or weakness. A green Neural Net Indicator communicates strength, while a red indicator forecasts short-term weakness in the market.
A Neural Net is a system that uses a network of functions to interpret large volumes of data and generate a desired output. It continually monitors itself and improves its performance over time.
To find optimal entry and exit points, we recommend that Power Traders use a double confirmation setup by cross-referencing the chart with both the predictive blue line and the Neural Network Indicator. This approach ensures that both the Neural Index and the a.i. are aligned in their trend forecast.
A neural network is a type of artificial intelligence that is modeled on the structure and function of the human brain. It is made up of a network of interconnected nodes or neurons that work together to process and interpret complex data sets.
In financial trading, neural networks are used to analyze vast amounts of market data and identify patterns and trends that are not immediately apparent to human traders. They can be used to forecast market movements, identify trading opportunities, and minimize risk.
Neural networks are particularly useful for analyzing non-linear and non-stationary data sets, such as financial market data. They can be trained in historical market data to identify patterns and relationships, and then used to make predictions about future market movements.
By using neural networks in financial trading, traders can make more informed and data-driven decisions, which can lead to more profitable trades and a better overall trading performance.
Power Traders always seek statistically sound trading opportunities by applying both the neural network and a.i. to the markets. To identify the best entry opportunities, we advise Power Traders to cross-reference the predictive blue line with the Neural Net.
Daily Trading Range Forecast
Over the past year here are the trading range performance metrics for $MKC on a daily, weekly, and monthly basis.
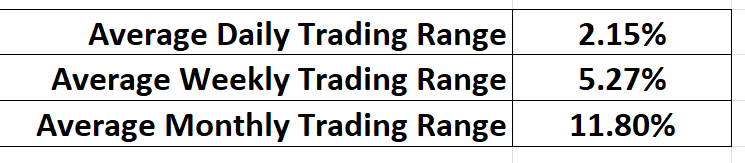
Power Traders rely on the Price Range prediction forecast, one of the powerful features of the VantagePoint Software, to fine-tune their entries and exits in the financial markets. Traders always need to decide on where to enter and exit the market, and that’s where VantagePoint’s A.I. comes into play with the Daily Price Range Forecast.
This chart helps traders identify where to place protective sell stops by observing the dark line on the chart, which is a powerful way to minimize risks in trades. Additionally, the upper and lower bands of the price range forecast create a clear channel for trading activity, providing swing traders with buying opportunities towards the bottom of the predicted channel and selling opportunities above the top band.
Intermarket Analysis
In the world of investing and trading, it can be difficult to separate facts from opinions. However, Vantagepoint Software stands out because of its ability to conduct Intermarket analysis, which helps identify assets that are most closely correlated with the price of $MKC and are responsible for driving it up or down.
If you’re interested in $MKC and its potential, you can use intermarket analysis to pinpoint other highly correlated assets that are key drivers of $MKC’s price. This is especially useful during times when broader market stock indexes are declining, and you’re searching for stocks or assets that move counter to major stock trends.
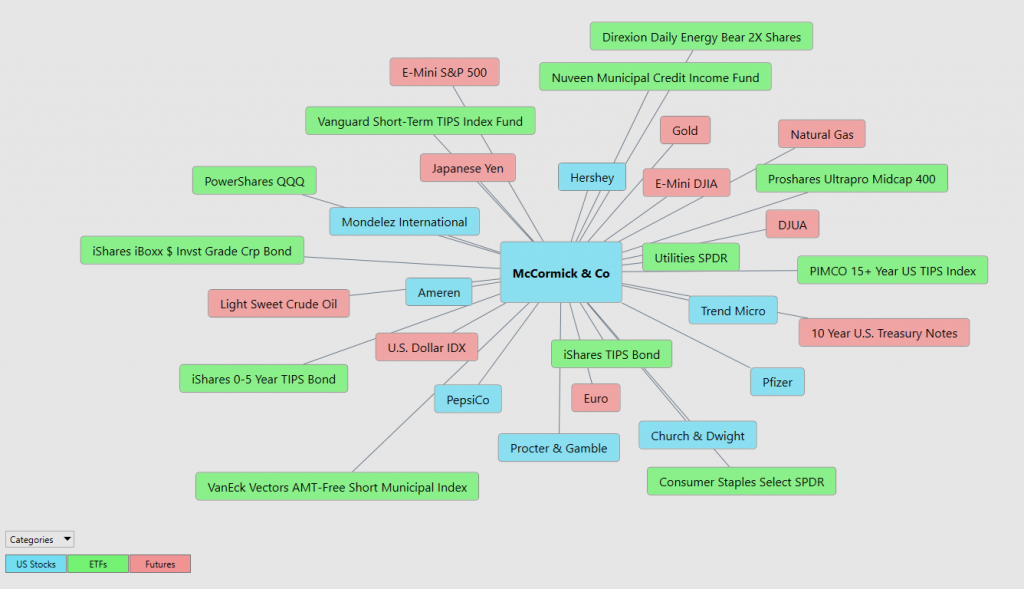
Although studying charts can provide insights into locating support and resistance levels, it’s crucial to remember that we live in a global marketplace where everything is interconnected. To make sound investment decisions, traders must understand the key drivers of an asset’s price.
These factors may not be visible to the naked eye, but they show high statistical correlations. Small changes in interest rates, crude oil prices, the volatility of the dollar, and thousands of other variables can have a significant impact on a company’s decision-making process. Identifying these key drivers is a major challenge for investors and traders.
Our Suggestion
While $MKC is a dividend aristocrat asset, as we have shown in this report, we are not long-term investors. Our loyalty is simply to the trend as dictated by artificial intelligence, neural networks and intermarkets.
As long as the blue line is positive, we will look to swing trade $MKC and capture as much of the buy and sell channel as possible. The a.i. has guided us well over the last 3 weeks.
Now, we all know that this negative trend has been weighing on the stock price lately, with its gross profit margin declining by 4 percentage points in the fourth quarter of 2021. But let’s be clear, this is likely a temporary setback.
McCormick faced pandemic-related disruptions in China, major supply chain challenges, spiking costs, unfavorable exchange rates, and demand pressures tied to recent price increases. But management has come out and said that these disappointments were tied to temporary challenges. Traders and investors alike will be paying close attention to their next earnings call, and they will hold the stock’s feet to the fire if earnings show any sign of continued weakness. The next earnings report is due on July 5, 2023.
McCormick is forecasting an imminent return to solid sales and earnings trends, with revenue expected to rise by 5% to 7% and operating income expanding by between 10% and 12%.
Let’s not forget that McCormick has a track record of sailing through similar selling environments. Just take a look at their dividend payment, which has risen in each of the last 37 years.
Smart investors know that this is evidence of excellent investment factors, including strong capital allocation, market leadership, and pricing power. And these elements should support further market-beating returns.
Our recommendation is – follow the A.I. trend analysis and practice good money management on all trades.
Trend is Up. Volatility is increasing. We expect $MKC to rise gradually over the coming weeks.
We will re-evaluate based upon:
- New Wall Street Analysts’ Estimates
- New 52-week high and low boundaries
- Vantagepoint A.I. Forecast (Predictive Blue Line)
- Neural Network Forecast
- Daily Range Forecast
Let’s Be Careful Out There!
Remember, It’s Not Magic.
It’s Machine Learning.

IMPORTANT NOTICE!
THERE IS SUBSTANTIAL RISK OF LOSS ASSOCIATED WITH TRADING. ONLY RISK CAPITAL SHOULD BE USED TO TRADE. TRADING STOCKS, FUTURES, OPTIONS, FOREX, AND ETFs IS NOT SUITABLE FOR EVERYONE.
DISCLAIMER: STOCKS, FUTURES, OPTIONS, ETFs AND CURRENCY TRADING ALL HAVE LARGE POTENTIAL REWARDS, BUT THEY ALSO HAVE LARGE POTENTIAL RISK. YOU MUST BE AWARE OF THE RISKS AND BE WILLING TO ACCEPT THEM IN ORDER TO INVEST IN THESE MARKETS. DON’T TRADE WITH MONEY YOU CAN’T AFFORD TO LOSE. THIS ARTICLE AND WEBSITE IS NEITHER A SOLICITATION NOR AN OFFER TO BUY/SELL FUTURES, OPTIONS, STOCKS, OR CURRENCIES. NO REPRESENTATION IS BEING MADE THAT ANY ACCOUNT WILL OR IS LIKELY TO ACHIEVE PROFITS OR LOSSES SIMILAR TO THOSE DISCUSSED ON THIS ARTICLE OR WEBSITE. THE PAST PERFORMANCE OF ANY TRADING SYSTEM OR METHODOLOGY IS NOT NECESSARILY INDICATIVE OF FUTURE RESULTS. CFTC RULE 4.41 – HYPOTHETICAL OR SIMULATED PERFORMANCE RESULTS HAVE CERTAIN LIMITATIONS. UNLIKE AN ACTUAL PERFORMANCE RECORD, SIMULATED RESULTS DO NOT REPRESENT ACTUAL TRADING. ALSO, SINCE THE TRADES HAVE NOT BEEN EXECUTED, THE RESULTS MAY HAVE UNDER-OR-OVER COMPENSATED FOR THE IMPACT, IF ANY, OF CERTAIN MARKET FACTORS, SUCH AS LACK OF LIQUIDITY. SIMULATED TRADING PROGRAMS IN GENERAL ARE ALSO SUBJECT TO THE FACT THAT THEY ARE DESIGNED WITH THE BENEFIT OF HINDSIGHT. NO REPRESENTATION IS BEING MADE THAT ANY ACCOUNT WILL OR IS LIKELY TO ACHIEVE PROFIT OR LOSSES SIMILAR TO THOSE SHOWN.

