
.png)
McDonald’s Corporation is an American fast-food company, founded in 1940 as a restaurant operated by Richard and Maurice McDonald, in San Bernardino, California. They rechristened their business as a hamburger stand, and later turned the company into a franchise, with the Golden Arches logo being introduced in 1953 at a location in Phoenix, Arizona. In 1955, Ray Kroc, a milkshake blender salesman turned businessman, joined the company as a franchise agent and proceeded to purchase the chain from the McDonald brothers. McDonald’s is headquartered in Chicago, Illinois and has a market cap of $176.135 billion.
McDonald’s is the world’s largest restaurant chain by revenue, serving over 69 million customers daily in over 100 countries across 39,198 outlets as of 2020. The average revenue per store is roughly $2.55 million per year. Although McDonald’s is best known for its hamburgers, cheeseburgers and French fries, the company has added to its menu salads, fish, smoothies, and fruit. The McDonald’s Corporation revenues come from the rent, royalties, and fees paid by the franchisees, as well as sales in company-operated restaurants. According to two reports published in 2018, McDonald’s is the world’s second-largest private employer with 1.7 million employees (behind Walmart with 2.3 million employees).
From a numbers and economic perspective, McDonalds is extremely popular because it is by far the most recognizable brand in the fast-food niche. There are 39,198 McDonalds restaurants throughout the world. One thing that customers know is that the food quality will be similar everywhere in the world. McDonald’s restaurants generate sales on the order of $100 billion per year. No other restaurant company comes close to the dominance McDonald’s enjoys.
McDonalds brand recognitions drives consumer loyalty. Nearly 70 million people visit a McDonalds restaurant every day.
As much as McDonald’s franchisees lament the rising fees, expenses, and required investments to run a restaurant, there’s no other restaurant name which is as reliable or as profitable for the franchisee. The average cost of establishing a new store can cost between $1 million and $2 million. But the average McDonalds restaurant reportedly does on the order of $255 million worth of business every year. About $150,000 is turned into a profit for the franchisee, although some stores clear considerably more.
As long as this remains the case, McDonald’s will continue to attract new franchisees and executive talent at the corporate level.
None of this is to suggest McDonald’s is bulletproof. It’s not.
For investors, and short-term traders though, paying a premium price for a “best-of-breed-franchise” pick typically pays for itself. Companies which dominate their niche are power players who have established very successful businesses over the long term.
This is why McDonalds is a stock to be reckoned with and to place firmly on your radar.
McDonalds next earnings date is July 27th, 2021 with earnings call shortly afterward. Currently 36 analysts monitor and report on McDonalds financial condition. Over the next 12 months the consensus of estimates has established a high price of of $282, a low price of $228 and a median price of $260. As of this writing, the stock is trading at $228 so it is currently trading on the lower end of the consensus estimates. The median price target represents a 14% increase from the current price. Power Traders like to see this wide divergence in opinion among analysts. It’s rare to find a stock that is undervalued by Wall Street as it creates great trading opportunities when the artificial intelligence creates a trend forecast.
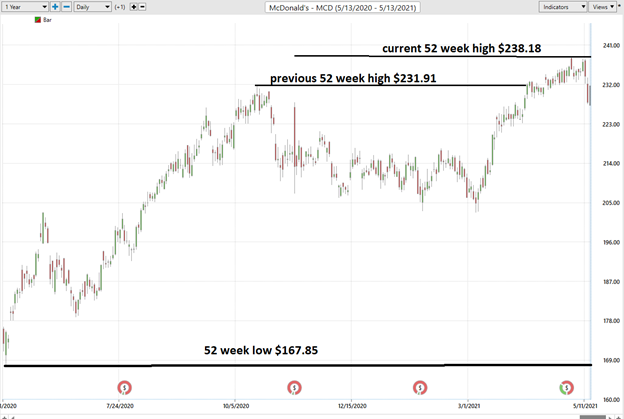
Over the last 52 weeks MCD has traded as high as $238.18 and as low as $167.85. This provides us with an annual trading range of $70.38. When we divide this metric by 52 weeks, we can determine that the average weekly trading range for MCD is roughly $1.35. We refer to these as the common-sense metrics which we use as baseline measurements of understanding normal value. When using artificial intelligence, we look to amplify our returns based upon these baseline measurements.
Whenever we trade, we always pay attention to where we are in relation to the 52-week trading range. It’s very common to see the 52-week high provide very strong resistance to the market until it is breached. Often when the 52-week high is breached we will see the stock price explode higher very quickly over a very short period of time. Most recently MCD encountered resistance at its most recent 52 week high and we suspect that the stock will be looking to establish a new support zone in that general area.
Whenever we look at a stock forecast, we always are comparing what the stock has done, to the artificial intelligence, which is computing its forecast based upon a proprietary intermarket analysis of the most closely correlated assets as well as a neural network computation.
The key to the VantagePoint analysis is the predictive blue line. The slope and general direction of the blue line determines the medium forecast for the market.
The Vantagepoint Software has three separate modules which create a forecast for a Power Trader. They are the predictive blue line, the Neural Net, and the Intermarket Analysis.
The software focuses on the daily price action. You’ll see that there’s a black line and also a blue line right up against the price data on the chart.
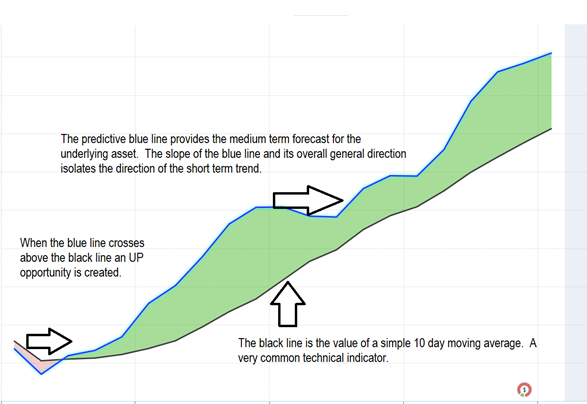
The black line you see is a regular simple 10 period moving average. A very common technical indicator. And it’s a good measure to go ahead and smooth out the price data and it gives us an indication of where market prices have been over a given period of time. But obviously as traders we really need to understand is where our market price is moving going forward.
So, what we want to do is compare that black line value on the chart to the predictive blue line, which is VantagePoint’s predictive indicator. VantagePoint is utilizing its technology to perform what’s called intermarket analysis. There’s known relationships as far as those neural networks are concerned that affect and drive the future price of McDonalds. That’s going to be things like the S&P 500 or the Russell 2000 or the NASDAQ. That’s going to be things like global currencies, live cattle prices or global interest rates, or futures and commodity markets.
VantagePoint is able to understand those relationships and what’s driving the future price of the target market that you might be trading and it’s actually generating future price predictions of where prices are likely to move. Then it’s utilizing those predictions and using them to construct these indicators you see against the charts. So, turning what was a lagging tool (that’s really only summarizing past data and past closes of what’s already occurred in the market) into a forward-looking predictive tool.
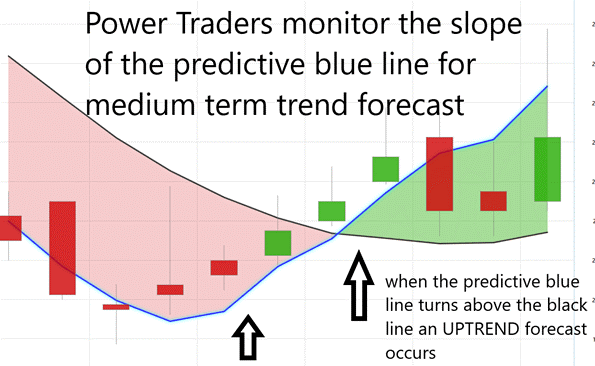
The slope of the predictive blue line determines the medium-term trend. In an uptrend, buyers usually like to buy the stock at or below the predictive blue line. In a downtrend traders usually like to sell at or above the predictive blue line.
So, whenever we have this blue line crossing above the black line its really suggesting average prices are expected to start moving higher and you therefore would likely look for long positions in the market.
The Vantagepoint A.I. Analysis
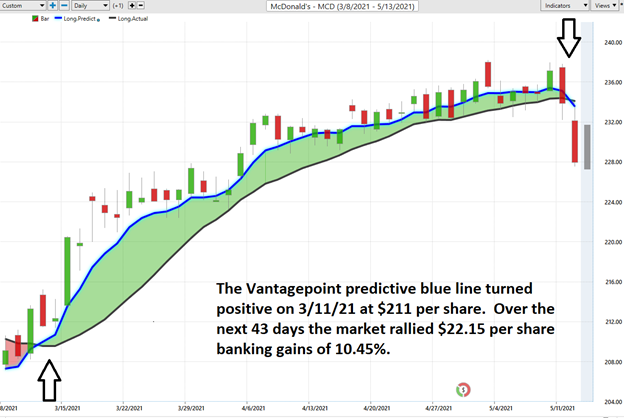
Power traders use the predictive blue line in helping to determine both the value zone as well as the trend direction.
Observe how the SLOPE of the predictive blue line started moving higher a few days previous to its moving above the black line. Traders had numerous opportunities to purchase at or below the predictive blue line as prices rallied substantially higher in the next few weeks.
Fine Tuning Entries with The Neural Net Indicator
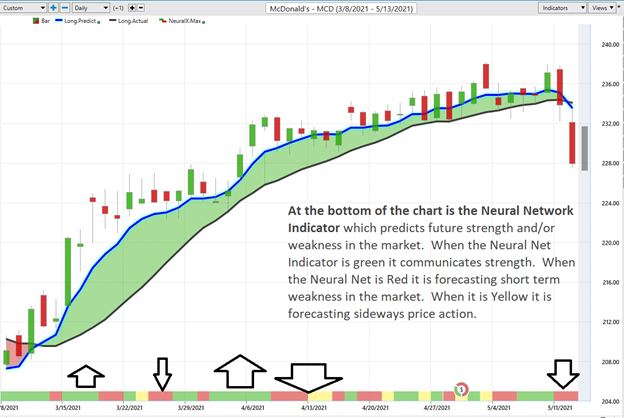
At the bottom of the chart is the Neural Network Indicator which predicts future strength and/or weakness in the market. When the Neural Net Indicator is green it communicates strength. When the Neural Net is Red it is forecasting short term weakness in the market.
We advocate that Power Traders cross reference the chart with the predictive blue line and neural network indicator to create optimal entry and exit points.
Power Traders are always looking to apply both the neural network and A.I. to the markets to find statistically sound trading opportunities.
In summary, the trend turned up on 3/11/21. Prices have surged since that forecast and the trend remained firmly UP until 5/12/21 when the Vantagepoint Trend forecast changed from Up to Down. Gains of 10%+ have been available to Power Traders who maintained positions throughout the entire trend cycle. Shorter term swing traders had multiple opportunities to trade in and out of the market within this larger trend over the last 45 trading sessions.
Daily Price Trading Range Forecast
If you look at the very right-hand side of the chart, you’ll see that there is what we call a predicted shadow candle. That’s actually a predicted high and a predicted low for the next trading day. So, you get an overall trend prediction, short-term strength, or weakness, and this predicted high and low. And what happens is you have these separate neural networks really doing all of this and looking at these different sorts of timeframes and creating a forward-looking analysis.
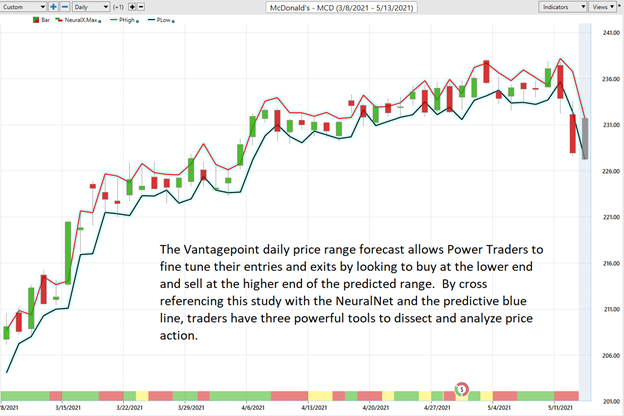
Power Traders try to use a price level below the predictive low price to place their protective sell stops in the market in case a sudden reversal was to occur. Observe how the predictive price low also provided numerous short term entry opportunities for traders to buy MCD as it was trending higher.
Intermarket Analysis
What makes Vantagepoint unique and distinct when compared to all other analytical tools is its patented and proprietary intermarket analysis.
Intermarket analysis is a method of analyzing markets by examining the correlations between different asset classes. In other words, what happens in one market could, and probably does, affect other markets, so a study of the relationship(s) is often very helpful to a trader.
Studying the charts can always provide objective realities in terms of locating support and resistance levels which become very clear on a chart. But we live in a global marketplace. Everything is interconnected. The billion-dollar question for traders is always what are the key drivers of price for the underlying asset that I am trading?
These intangibles are invisible to the naked eye yet are responsible for driving prices. These markets show very high statistical correlations.
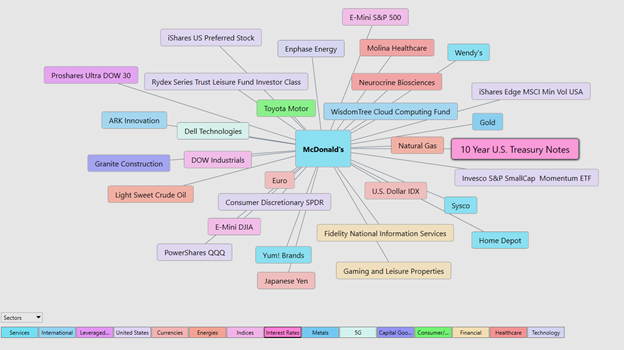
Instead of looking at financial markets or asset classes on an individual basis, intermarket analysis looks at several strongly correlated markets, or asset classes, such as other stocks, currencies, ETF’s, and commodities. This type of analysis expands on simply looking at each individual market or asset in isolation by also looking at other markets or assets that have a strong relationship to the market or asset being considered. The VantagePoint software analyzes the top 31 drivers of an assets price. This analysis will often show ETF’s which are big owners of the underlying asset, but it will also uncover other markets which are statistically correlated to the trend you are analyzing. Traders often find other blossoming opportunities when engaging in Intermarket Analysis.
There is great value to be had in studying and understanding the key drivers of MCD price action. Naturally, we would expect to see other “fast food” conglomerates like YUM! Brands and Wendy’s. But interestingly enough, McDonalds has been very closely correlated to the price action in the Dow and S&P 500 Index as well as Crude Oil. This understanding can be invaluable in finding other trading opportunities as well as deciding how long you decide to stay in a trade.
Our suggestion – The consensus of analyst opinions shows that MCD is undervalued at current prices of $228. However, we think trading based upon the A.I. forecast will help you find the best opportunities. We look at the other fundamental metrics to better understand the landscape that we are operating under. The A.I. forecast turned DOWN on 5/12/21. The high-end estimate over the next 12 months is $282. The median forecast is $260. We do not believe there is a lot of downside in MCD at the present. Aggressive traders can entertain the idea of selling PUT options to collect premium into their accounts. This should only be done by seasoned veterans who are comfortable being assigned long positions in the future based upon the premium you collect into your account. Based upon this reality we think there are better risk reward scenarios in other markets over the short term.
Overall, we suspect the market will chop around looking for support over the next few weeks in and around the current price levels. Since the A.I. forecast is down, most traders will sit on the sidelines and not commit to buying this market until the forecast changes.
Longer term possibilities may surpass the higher end of the analysts’ estimates at $282 later this year, particularly as the economy opens back up. MCD could be a big beneficiary.
The next earnings call on 7/27/21 will act as a spark for greater volatility and we think we will be able to get long again before the next earnings call at hopefully lower levels.
We have it firmly on the radar to look for weakness as long as the A.I. forecasts UP.
Follow the A.I. trend analysis, pay close attention to the daily price range forecast, and look for the lower end of the range. Practice good money management on all of your trades. MCD deserves to be on your trading radar. It truly is one of the bluest of blue-chip stocks!
Let’s Be Careful Out There!
Remember, It’s Not Magic.
It’s Machine Learning.

IMPORTANT NOTICE!
THERE IS SUBSTANTIAL RISK OF LOSS ASSOCIATED WITH TRADING. ONLY RISK CAPITAL SHOULD BE USED TO TRADE. TRADING STOCKS, FUTURES, OPTIONS, FOREX, AND ETFs IS NOT SUITABLE FOR EVERYONE.
DISCLAIMER: STOCKS, FUTURES, OPTIONS, ETFs AND CURRENCY TRADING ALL HAVE LARGE POTENTIAL REWARDS, BUT THEY ALSO HAVE LARGE POTENTIAL RISK. YOU MUST BE AWARE OF THE RISKS AND BE WILLING TO ACCEPT THEM IN ORDER TO INVEST IN THESE MARKETS. DON’T TRADE WITH MONEY YOU CAN’T AFFORD TO LOSE. THIS ARTICLE AND WEBSITE IS NEITHER A SOLICITATION NOR AN OFFER TO BUY/SELL FUTURES, OPTIONS, STOCKS, OR CURRENCIES. NO REPRESENTATION IS BEING MADE THAT ANY ACCOUNT WILL OR IS LIKELY TO ACHIEVE PROFITS OR LOSSES SIMILAR TO THOSE DISCUSSED ON THIS ARTICLE OR WEBSITE. THE PAST PERFORMANCE OF ANY TRADING SYSTEM OR METHODOLOGY IS NOT NECESSARILY INDICATIVE OF FUTURE RESULTS. CFTC RULE 4.41 – HYPOTHETICAL OR SIMULATED PERFORMANCE RESULTS HAVE CERTAIN LIMITATIONS. UNLIKE AN ACTUAL PERFORMANCE RECORD, SIMULATED RESULTS DO NOT REPRESENT ACTUAL TRADING. ALSO, SINCE THE TRADES HAVE NOT BEEN EXECUTED, THE RESULTS MAY HAVE UNDER-OR-OVER COMPENSATED FOR THE IMPACT, IF ANY, OF CERTAIN MARKET FACTORS, SUCH AS LACK OF LIQUIDITY. SIMULATED TRADING PROGRAMS IN GENERAL ARE ALSO SUBJECT TO THE FACT THAT THEY ARE DESIGNED WITH THE BENEFIT OF HINDSIGHT. NO REPRESENTATION IS BEING MADE THAT ANY ACCOUNT WILL OR IS LIKELY TO ACHIEVE PROFIT OR LOSSES SIMILAR TO THOSE SHOWN.

