
Two months ago in our Weekly Blog Post, I wrote a detailed article about concerns I had with economic conditions. The article was titled: Inflation, The Fed, and Corporate Insiders – Are We Witnessing A Major Stock Market Top? In that article, I focused on the reality that corporate insiders were selling their shares at the highest level in history. When you combined that concern with Fed Tightening and Higher Inflation concerns it certainly had all the makings of a major stock market top.
Since that article was published, we have seen the FAANG stocks drop anywhere from 10% to as much as 36%. Inflation via the CPI has printed at 7.5% in the past week. Producer Prices have increased at a 9.7% rate year over year. The Federal Reserve has stated they will start raising interest rates in March and will stop purchasing U.S. Treasury Bonds as well. More importantly, Power Traders were forewarned to pay close attention to the a.i. forecasts in any of the leading FAANG stocks as there certainly are troubles on the horizon.
Today we will focus on Meta, formerly known as Facebook ($FB). In October 2021 Facebook rebranded itself as Meta Platforms and positioned itself as the clear leader for dominance of the Metaverse, the embodiment of the internet through tools like virtual reality headsets. However, the rebranding has not been without its share of problems.
The division of Facebook called Reality Labs comprises 2% of the company and now this division is where CEO Mark Zuckerberg has decided the company should focus all its attention and resources on. The company is losing a great deal of money on Research and Development. Optimists will argus that R&D investment for Facebook is analogous to Amazon’s huge investment in infrastructure and logistics before it became hugely popular. The facts are that over the last four quarters the company posted a $10.2 billion operating loss in its METAVERSE research and development, and it expects this loss to grow meaningfully in 2022.
While the metaverse is the augmentation of virtual reality, and augmented reality. Understanding the Metaverse boils down to the perspective that its implementation consists of users being online 100% of the time. Instead of accessing the online world, a user and their avatar are ALWAYS online. The industry is clearly in its embryonic stages. Analysts perceive the companies big rebranding as a huge money loser for at least two years. There is no way to forecast how long it will take for the Metaverse to evolve and how monetization strategies of this technological wonder will develop.
Additionally, what concerns many investors are the legal issues that Meta has had recently regarding users’ privacy and data. Many countries in the European Union are at odds with the companies’ collection and selling of user data. Major lawsuits abound.
The newest legal troubles in the United States are that the Federal Trade Commission has filed a lawsuit against Facebook alleging the platform has a monopoly in social media and that it has abused its power and harmed its competition. A federal judge greenlighted the lawsuit on Jan. 11
These fears were recently exacerbated when the company reported that for the first time in its history it lost a half million users. The following day Meta shares plummeted 26%.
But when you crunch the numbers on the financial statement of the company, they still look quite healthy.
- Annual revenue was $118 billion, up 37% year-over-year (YOY)
- Net income was $39 billion, up 35% YOY
In 2012 Facebook made the huge transition to mobile. With hindsight the move was astute and visionary. But in 2012 users had cell phones. Today Facebook is betting on a technology that is still a few years away and very few in its userbase own Virtual Reality headsets which are the essential requirements to access the Metaverse.
After Facebook’s steep plunge, Wall Street looks at Meta Platforms like a value stock because it is trading at roughly 17 times earnings. This is incredibly cheap for a tech stock. This puts the tech giant in the same category as conservative banks and healthcare-related assets.
As we mentioned in Inflation, The Fed, and Corporate Insiders – Are We Witnessing A Major Stock Market Top? Insiders at Facebook were huge sellers in the 4th quarter of 2021. The question now remains as to whether they will step in and buy after this sharp pullback or will they remain on the sidelines.
Moving forward you can quickly categorize the bullish and bearish arguments for META Platforms. The bears see legal issues and the Reality Labs division bleeding money for at least two years. The bulls see the dominant social media company in the world with strong cash flow and earnings that will continue to dominate its industry.
In this stock analysis we will evaluate the following metrics and indicators to determine what the best course of action is regarding $FB stock trading.
- Wall Street Analysts’ Estimates
- 52-week high and low boundaries
- Vantagepoint A.I. Forecast (Triple Cross)
- Neural Network Forecast
- Bollinger Band Analysis
- Intermarket Analysis
- Our Suggestiion
We don’t base decisions on things like earnings or fundamental cash flow valuations. However, we do look at them to better understand the financial landscape that a company is operating under.
Analysts Ratings
The very first thing we like to do in our analysis is to take a quick look at what the Wall Street Analysts are thinking about $FB.
Based on 44 Wall Street analysts offering 12-month price targets for Meta Platforms in the last 3 months.The average price target is $332.14 with a high forecast of $466.00 and a low forecast of $225.00. The average price target represents a 50.29% change from the last price of $221.00.
This tells us that the brightest minds on Wall Street which watch the stock full time think that $FB is dramatically undervalued at the present time.
52-week High-Low Chart
Next, we want to see where we are trading in relation to the 52-week range.
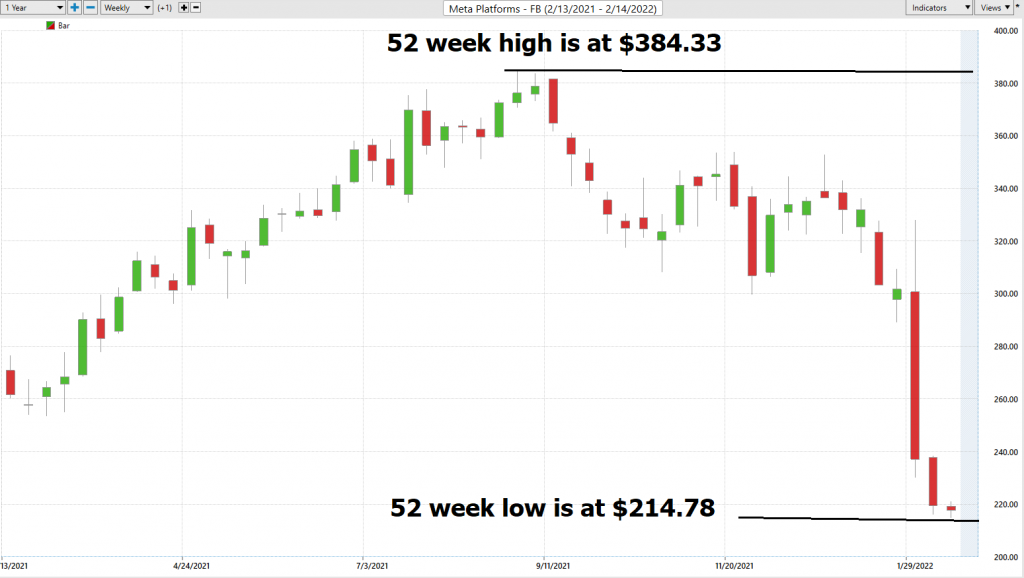
Over the last 52 weeks $FB has traded as high as $384.33 and as low as 214.78. This provides us with an annual trading range of $169.55 When we divide this metric by 52 weeks, we can determine that the average weekly trading range for $FB is $3.26. What we often like to do as well is to divide the annual trading range ($169.55) by the current price ($217.70) to provide us with a very basic and generic calculation of how the annualized volatility for $FB, which is currently 77.8%. This volatility value is very high in comparison to its historical average as well as to other tech stocks. What this number tells us is that volatility is currently very high in $FB. This is an ideal environment for short term swing traders as well as savvy option traders who know how to sell option premium and manage risk.
Whenever we trade, we always pay attention to where we are in relation to the 52-week trading range. It is very common to see the 52-week high provide very strong resistance to the market until it is breached. Often when the 52-week high is breached we will see the stock price explode higher very quickly over a very short period.
Zooming out on the stock, we also like to look at where we are in relation to the 10-year annual range. $FB has lost 19% year over year. Historically $FB shares have always been a huge BUY whenever this has occurred in the past.
Best Case – Worst-Case Scenarios
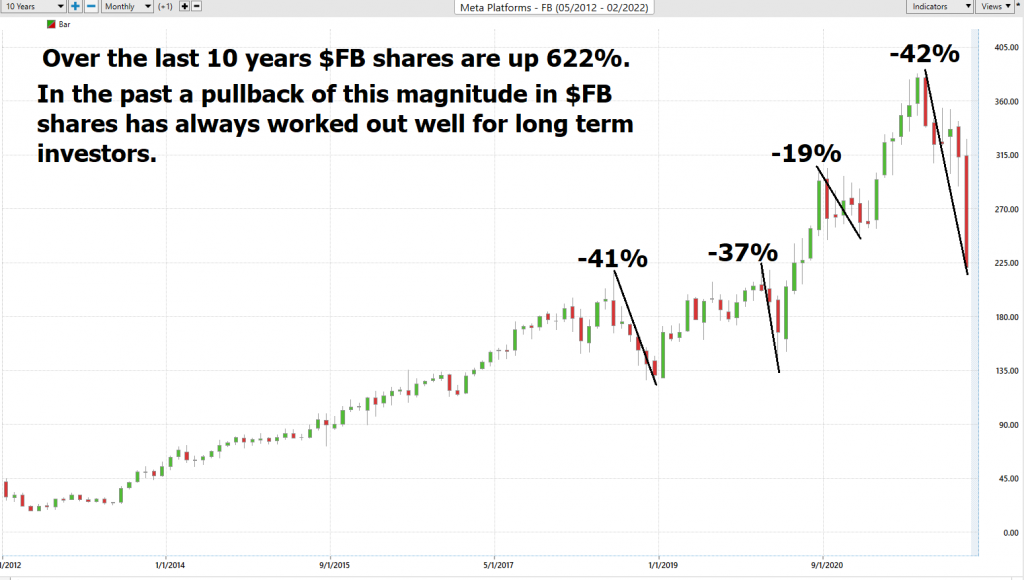
Over the last 10 years $FB shares are up 622%.
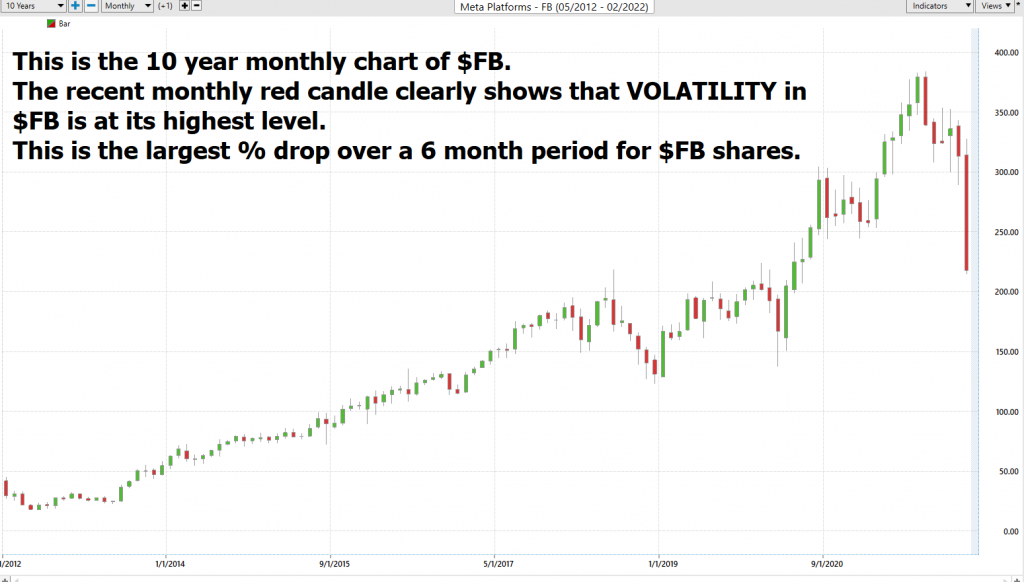
When we study the long term 52-week chart we can look at the best case and worst-case scenarios just to get an eyeball perspective of the risk and volatility of this asset. This is worth doing anytime you invest or trade to monetarily understand what the potential risks and rewards have been over the past decade. In the 52-Week Analysis we already concluded that the volatility of $FB was very high at 77%%. That number tells us that “NORMAL” is defined as prices one year from now being between 77%% higher or lower than the current price. That would have us looking at a prospective range of $384 to $50 as extreme measures over the coming year.
Here is a snapshot of the drawdowns that $FB has experienced over the past decade measured on a percentage basis. In the past decade any time that $FB shares were selling 30% or greater below its most recent high presented a great buying opportunity for longer term investors.
It’s worth doing this type of baseline analysis because it allows you to quickly compare understand the performance of $FB and to understand its risk and reward possibilities.
Next, we compare $FB to the major broad market indexes. Over the past year $FB has been a major laggard.
$FB -19.33%%
S&P 500 Index +13.69%
Dow Jones Industrials +11%
NASDAQ +21.56%
Russell 1000 Index +10.82%
So, in $FB we have an asset which has massively underperformed the broader stock market indexes. It’s trading at the low of its 52-week range.
The Vantagepoint A.I. Analysis
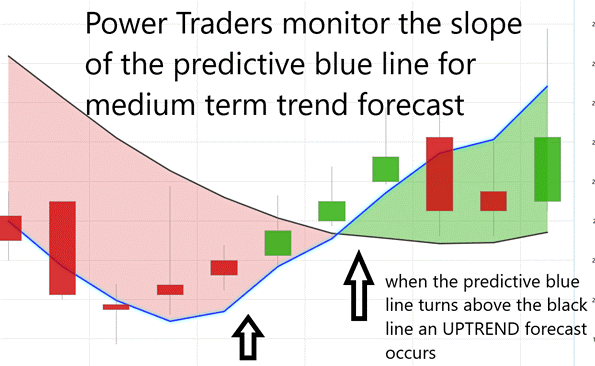
Using VantagePoint Software and the artificial intelligence, traders are alerted to trend forecasts by monitoring the slope of the predictive blue line. The black line is a simple 10 day moving average of price which simply tells you what has occurred in the market. The predictive blue line also acts as value zone where in uptrends traders try to purchase the asset at or below the blue line.
In studying the chart below pay close attention to the slope of the blue line.
The Vantagepoint A.I. Triple Cross indicator is a combination of the short term, medium term and long term a.i. forecasts all placed on to one chart.
Power Traders pay close attention to the relationship between where price closes in relation to the slope of the predictive blue line. between the black line and predictive blue line. On January 5, 2022, $FB closed below the predictive blue line signaling a DOWN forecast at a price of $324.71.
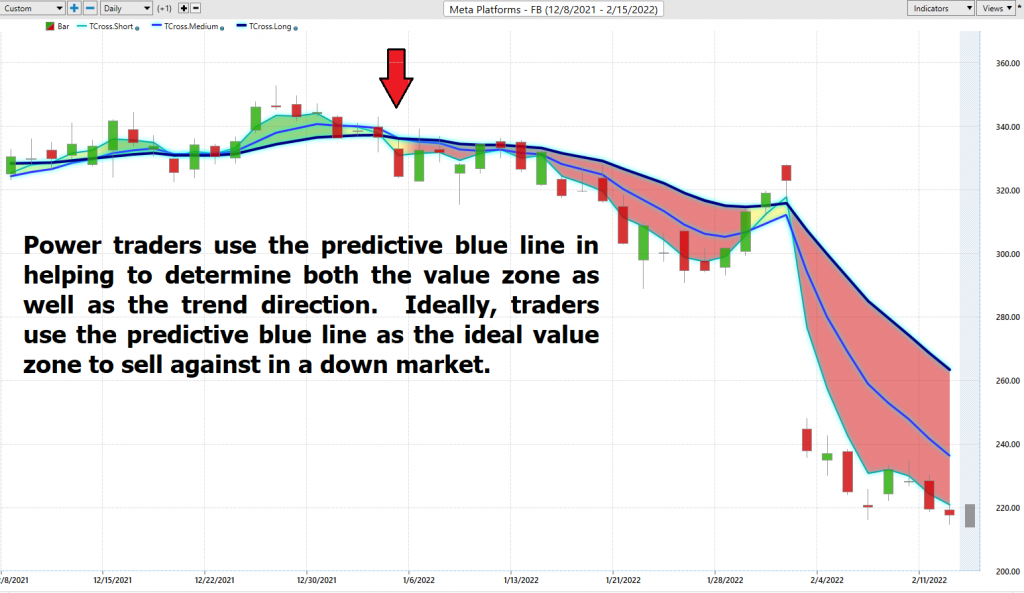
Power traders use the predictive blue line in helping to determine both the value zone as well as the trend direction. Ideally, traders use the predictive blue line as the ideal value zone to sell against in a down market.
Fine Tuning Entries with The Neural Net Indicator
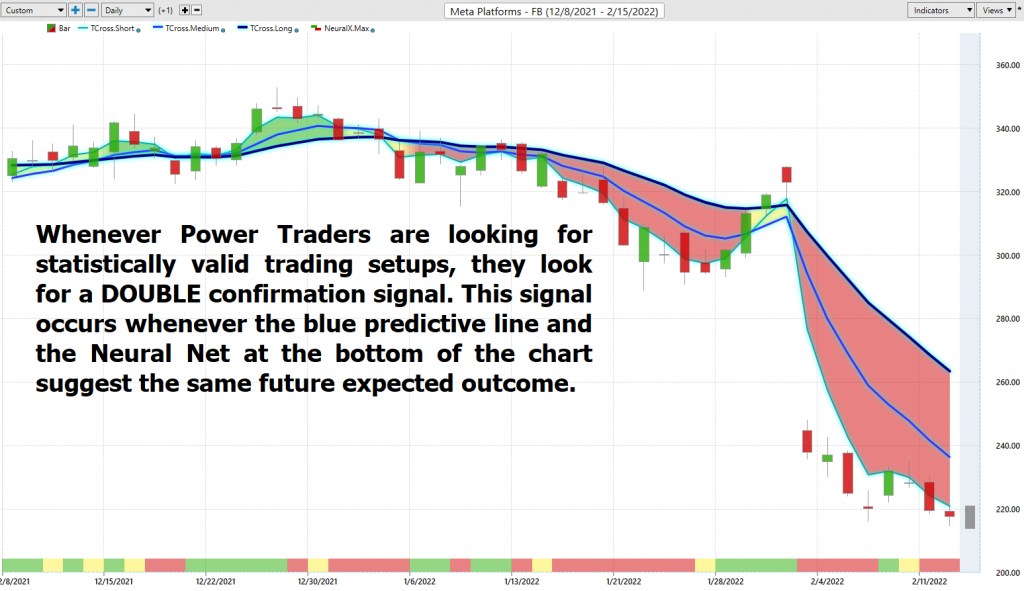
At the bottom of the chart is the Neural Network Indicator which predicts future strength and/or weakness in the market. When the Neural Net Indicator is green it communicates strength. When the Neural Net is Red it is forecasting short term weakness in the market.
A Neural Net is a computational learning system that uses a network of functions to understand and translate massive amounts of data into a desired output, consistently monitoring itself and improving its performance.
Whenever Power Traders are looking for statistically valid trading setups, they look for a DOUBLE confirmation signal. This signal occurs whenever the blue predictive line and the Neural Net at the bottom of the chart suggest the same future expected outcome.
We advocate that Power Traders cross reference the chart with the predictive blue line and neural network indicator to create optimal entry and exit points.
Power Traders are always looking to apply both the neural network and a.i. to the markets to find statistically sound trading opportunities.
We advise Power Traders to cross reference the predictive blue line with the Neural Net for the best entry opportunities.
Whenever Power Traders are looking for statistically valid trading setups, they look for a DOUBLE confirmation signal. This signal occurs whenever the blue predictive line and the Neural Net at the bottom of the chart suggest the same future expected outcome.
Bollinger Band Analysis
Bollinger Bands are composed of three lines. The middle line is usually a simple 20 day moving average. The upper and lower bands are computed by looking at the daily volatility of the asset and adding and subtracting twice that VOLATILITY value to the middle line.
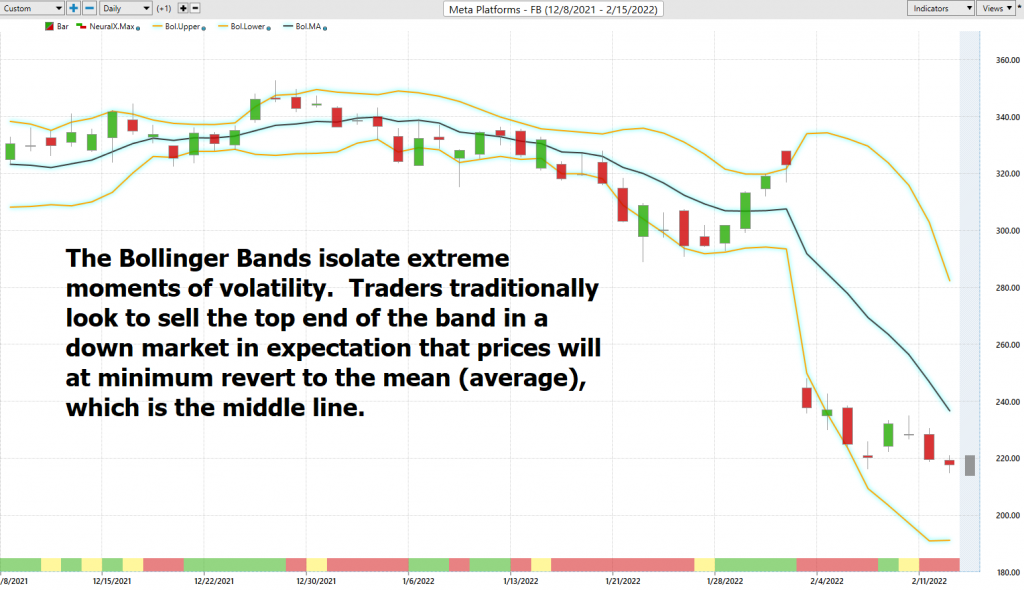
Bollinger observed that the price of an asset congregated around its average (mean) and the outer limits of its price action were based upon the measure of volatility.
The indicators can be used in many different ways in rangebound and trending markets. However, one of its primary uses is to look at it as a mean reversion indicator. This idea is rooted in the premise that when price deviates too far from the mean it eventually reverts back to the mean or the lower Bollinger Band.
Intermarket Analysis
What makes the Vantagepoint Software truly unique is its ability to perform Intermarket analysis and to locate those assets which are most interconnected that are responsible for driving the price of $FB higher or lower.
Studying the charts can always provide objective realities in terms of locating support and resistance levels which become very clear on a chart. But we live in a global marketplace. Everything is interconnected. The billion-dollar question for traders is always what are the key drivers of price for the underlying asset that I am trading?
These intangibles are invisible to the naked eye yet show very high statistical correlations.
Small changes in Interest rates, Crude Oil Prices, and the Volatility of the dollar amongst thousands of other variables affect the decisions companies must make to survive in these very challenging times. Trying to determine what these factors are is one of the huge problems facing investors and traders.
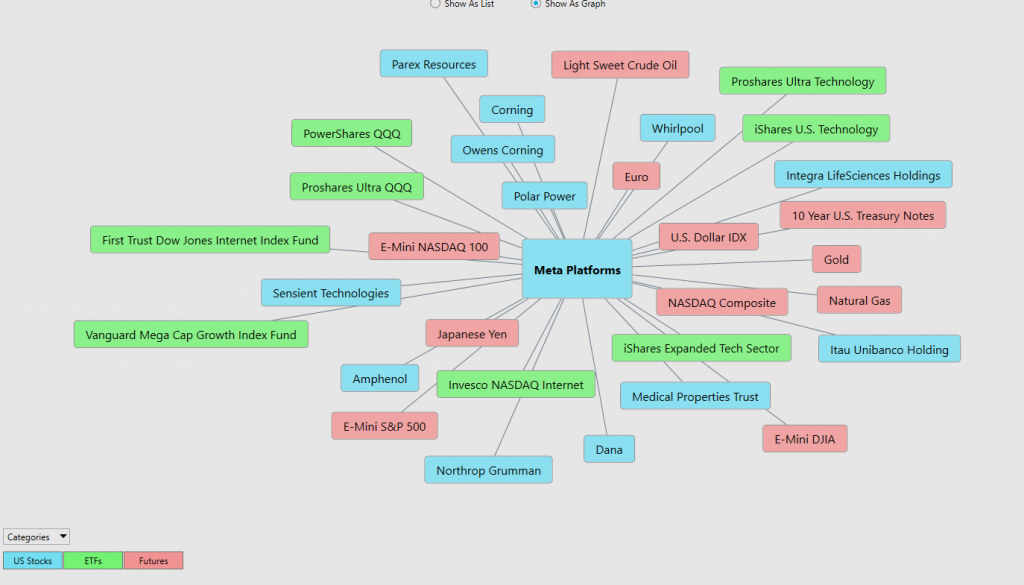
There is great value to be had in studying and understanding the key drivers of $FB price action.
By doing so you can often see which ETFs are most likely acquiring $FB as well as uncovering other industries, commodities, forex which affect $FB price movement.
By studying the Intermarket cross-reference regularly, you can regularly find other trading gems that are highly correlated to the price action of $FB.
Our Suggestion
The next Earnings Report date for $FB is tentatively scheduled for April 26, 2022, and it will be a key driver of the stock price for the remainder of 2022. The expectations are that Reality Labs will continue to build out its Metaverse technology at a substantial cost to the company’s bottom line. There will also be news related to the companies’ numerous lawsuits in the EU and USA related to privacy concerns.
The trend is clearly down.
The chart has a massive gap between $248 and $316.87.
The price action suggests that the recent lows at $212.36 will be tested repeatedly before evidence of consolidation and stability can emerge.
We have $FB on our radar. We are looking to buy when the conditions are correct for a very fast upswing, but the timing is still out in the future.
The definition of an uptrend is higher highs and higher lows and now the $FB chart is making lower lows and lower highs. New lows may be made, and we will wait to see if that brings in more volume or more liquidation.
Our experience tells us that when $FB rebounds it will be fast and furious, and we will await guidance from the a.i. to position ourselves accordingly.
Let’s Be Careful Out There!
Remember, It’s Not Magic.
It’s Machine Learning.

IMPORTANT NOTICE!
THERE IS SUBSTANTIAL RISK OF LOSS ASSOCIATED WITH TRADING. ONLY RISK CAPITAL SHOULD BE USED TO TRADE. TRADING STOCKS, FUTURES, OPTIONS, FOREX, AND ETFs IS NOT SUITABLE FOR EVERYONE.
DISCLAIMER: STOCKS, FUTURES, OPTIONS, ETFs AND CURRENCY TRADING ALL HAVE LARGE POTENTIAL REWARDS, BUT THEY ALSO HAVE LARGE POTENTIAL RISK. YOU MUST BE AWARE OF THE RISKS AND BE WILLING TO ACCEPT THEM IN ORDER TO INVEST IN THESE MARKETS. DON’T TRADE WITH MONEY YOU CAN’T AFFORD TO LOSE. THIS ARTICLE AND WEBSITE IS NEITHER A SOLICITATION NOR AN OFFER TO BUY/SELL FUTURES, OPTIONS, STOCKS, OR CURRENCIES. NO REPRESENTATION IS BEING MADE THAT ANY ACCOUNT WILL OR IS LIKELY TO ACHIEVE PROFITS OR LOSSES SIMILAR TO THOSE DISCUSSED ON THIS ARTICLE OR WEBSITE. THE PAST PERFORMANCE OF ANY TRADING SYSTEM OR METHODOLOGY IS NOT NECESSARILY INDICATIVE OF FUTURE RESULTS. CFTC RULE 4.41 – HYPOTHETICAL OR SIMULATED PERFORMANCE RESULTS HAVE CERTAIN LIMITATIONS. UNLIKE AN ACTUAL PERFORMANCE RECORD, SIMULATED RESULTS DO NOT REPRESENT ACTUAL TRADING. ALSO, SINCE THE TRADES HAVE NOT BEEN EXECUTED, THE RESULTS MAY HAVE UNDER-OR-OVER COMPENSATED FOR THE IMPACT, IF ANY, OF CERTAIN MARKET FACTORS, SUCH AS LACK OF LIQUIDITY. SIMULATED TRADING PROGRAMS IN GENERAL ARE ALSO SUBJECT TO THE FACT THAT THEY ARE DESIGNED WITH THE BENEFIT OF HINDSIGHT. NO REPRESENTATION IS BEING MADE THAT ANY ACCOUNT WILL OR IS LIKELY TO ACHIEVE PROFIT OR LOSSES SIMILAR TO THOSE SHOWN.

