
One stock that’s been on many people’s minds is Microsoft ($MSFT). Since making its 52-week low 23 weeks ago it has rallied as much as 36% and outperformed the broader market by a very wide margin.
Now, Microsoft is no stranger to success, with a massive market cap of $2.15 trillion.
So, what’s the deal with Microsoft? Well, for starters, the company has been capitalizing on the shift to cloud computing, which has only been accelerated by the pandemic. Its Azure cloud platform has been gaining market share on rivals like Amazon Web Services and Google Cloud, and the company’s overall cloud revenue has been growing at a rapid pace.
But that’s not all. Microsoft has also been investing heavily in other areas of growth, such as artificial intelligence and gaming. Its Xbox division has been doing exceptionally well, and the recent acquisition of Activision Blizzard has the potential to be a game-changer.
Microsoft Corporation generates income from the following sources:
Productivity and Business Processes: This segment includes sales of Office 365 Commercial and Consumer, LinkedIn, Dynamics business solutions, and other productivity-related products and services.
Intelligent Cloud: This segment includes sales of server products and services, Azure, GitHub, and other enterprise services.
More Personal Computing: This segment includes sales of Windows, Surface devices, gaming, and search advertising.
Microsoft is investing heavily in cloud computing, artificial intelligence as well as quantum computing and mixed reality.
So, what’s the bottom line? If you’re looking for solid swing trading opportunities in the tech sector, Microsoft could be just the ticket. With a track record of success and a commitment to innovation, this company is well positioned for continued growth in the years to come.
In this weekly stock study, we will look at and analyze the following indicators and metrics which are our guidelines which dictate our behavior in deciding whether to look for opportunities to buy, sell, or stand aside on a particular stock. We will also look at specific options trading tactics that develop meaningful risk/reward ratios in the current trading environment.
- Wall Street Analysts’ Estimates
- 52-week high and low boundaries
- Vantagepoint A.I. Forecast (Predictive Blue Line)
- The Best Case – Worst Case Scenarios
- Neural Network Forecast
- Daily Range Forecast
- Intermarket Analysis
- Our trading suggestion
We don’t base our decisions on things like earnings or fundamental cash flow valuations. However, we do look at them to better understand the financial landscape that a company is operating under.
Analysts Ratings
Based on 32 Wall Street analysts offering 12-month price targets for Microsoft in the last 3 months. The average price target is $301.83 with a high forecast of $411.00 and a low forecast of $241.00. The average price target represents a 4.67% change from the last price of $288.37.
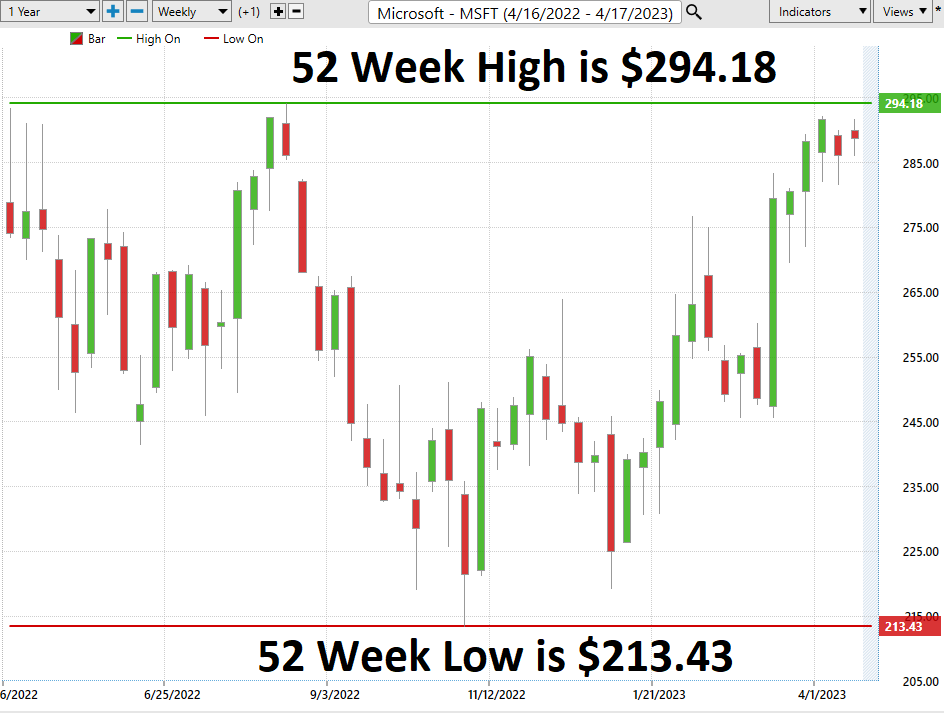
52-week High-Low Chart
Looking at the Long-Term chart of $MSFT provides us with the 52-week high and low boundaries. Over the past year we have seen $MSFT trade as low as $213.43 and as high as $294.18. The annual trading range has been $80.75.
Currently, the stock is trading at its 93rd percentile of the last 52-week range.
What we also like to do is to divide the current price by the annual trading range to get a measure of annualized volatility. This metric tells us what we can expect over the next 12 months should it be like the last 12 months. Currently, the annualized volatility in $MSFT is 28%.
It is important for traders to understand the annualized statistical volatility of a stock, as this concept serves as an essential tool that helps measure and anticipate future market movements. The higher the annualized statistical volatility for a stock, the more volatile it will be, indicating more potential movement up or down. A trader should not solely rely on this number when assessing a stock’s performance as there are many factors to consider; however, understanding annualized statistical volatility can provide valuable insight into a stock’s performance trajectory, past and present.
Simply looking at the chart you can see the volatile journey it has been on. What is impressive is that $MSFT has made up all of the losses that were generated in 2022.
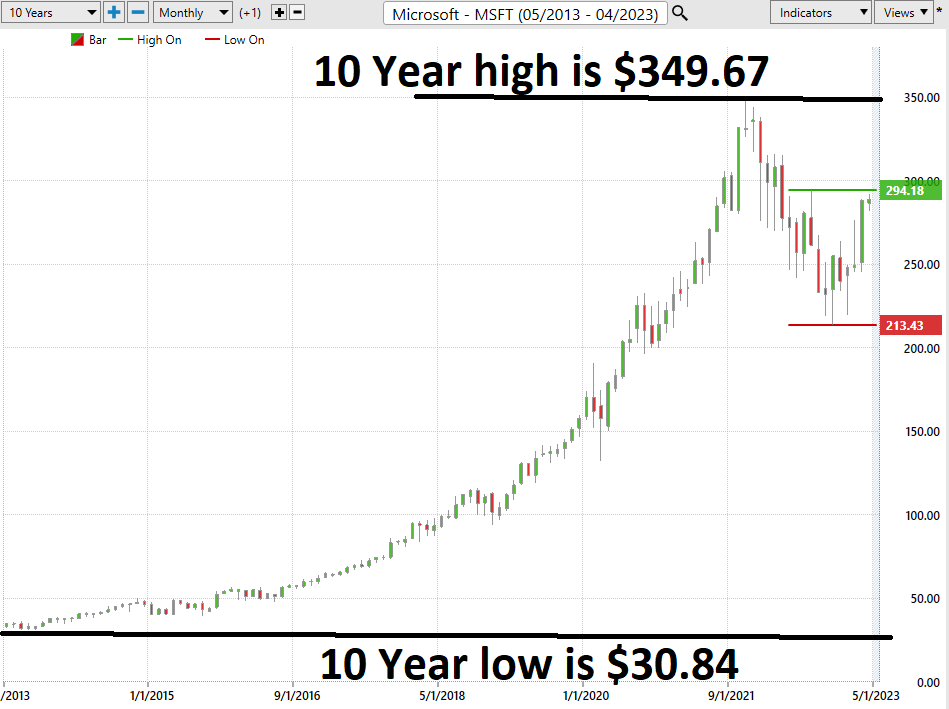
When we zoom out and look at the 10-year monthly chart we can quickly see what a tremendous long-term growth trend $MSFT has been on. Over the last 10 years, the 10 year high has been $349.67, and the ten years low has been $30.84.
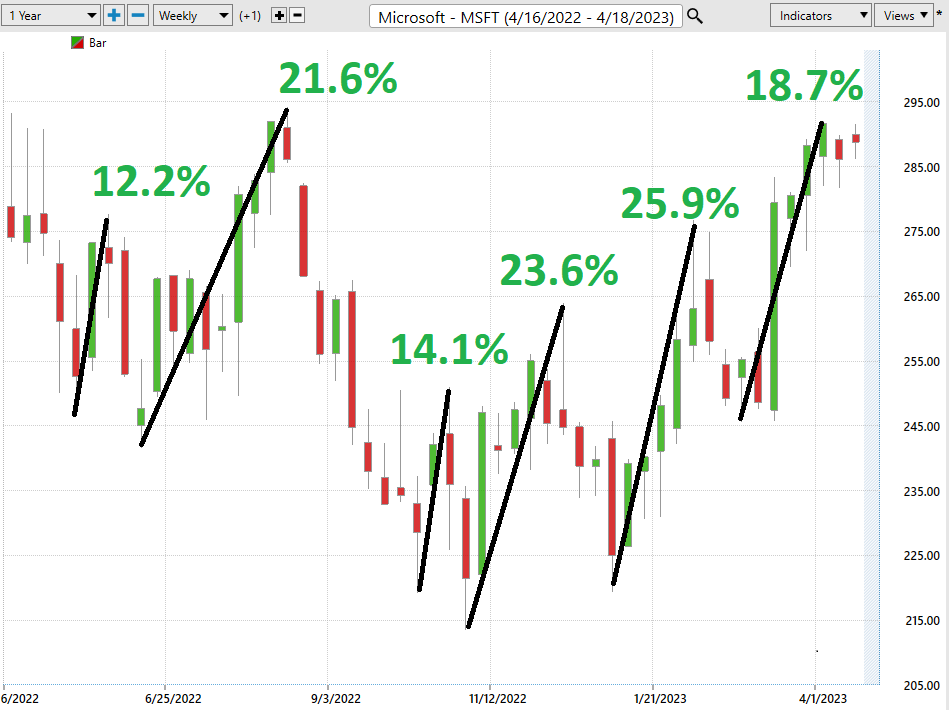
Best Case – Worst Case Scenario
When we study the long term 52-week chart we can look at the best case and worst-case scenarios just to get an eyeball perspective of the risk and volatility of this asset. This is worth doing anytime you invest or trade to monetarily understand what the potential risks and rewards have been over the past year. All that we are looking to analyze is the distance and speed between highs and lows over a given year.
It is worth doing this type of baseline analysis because it allows you to visually ascertain how quickly a stock drops in comparison to the speed with which it moves higher.
First, we do the Best-Case analysis:
Followed by the WORST-CASE Analysis:
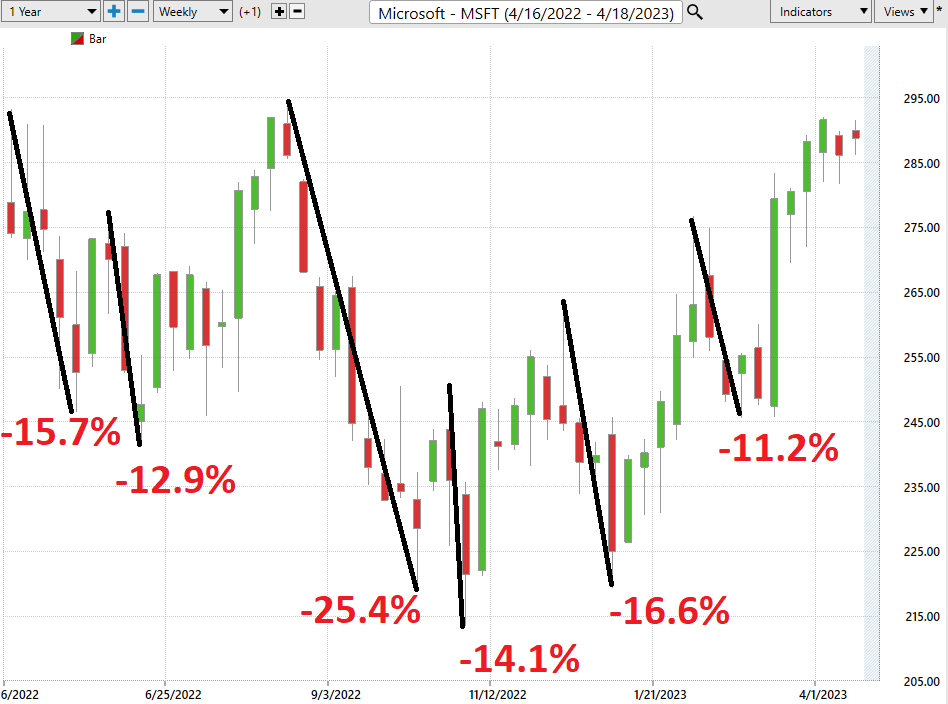
This initial analysis lets us see how quickly $MSFT falls in comparison to its rallies. In this regard we can quickly see that the declines for the most part are larger than the rallies.
Next, we want to compare the performance of $MSFT to the major broad market indexes.
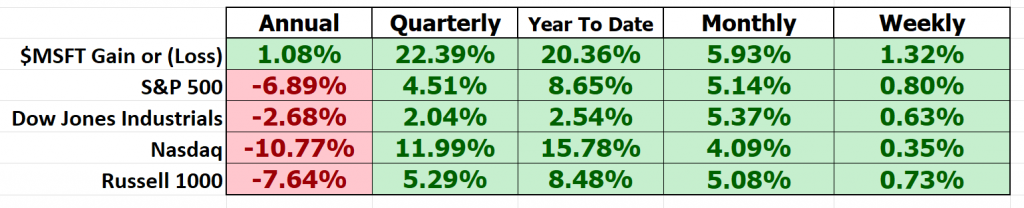
So, in $MSFT we have an asset that has outperformed the broader market across the board.
Observe how most of the gains and retracements stay within the annualized statistical volatility range of 28%.
Lastly, let’s look at the correlation of MSFT to the Nasdaq ($QQQ) as well as to the $XLK.
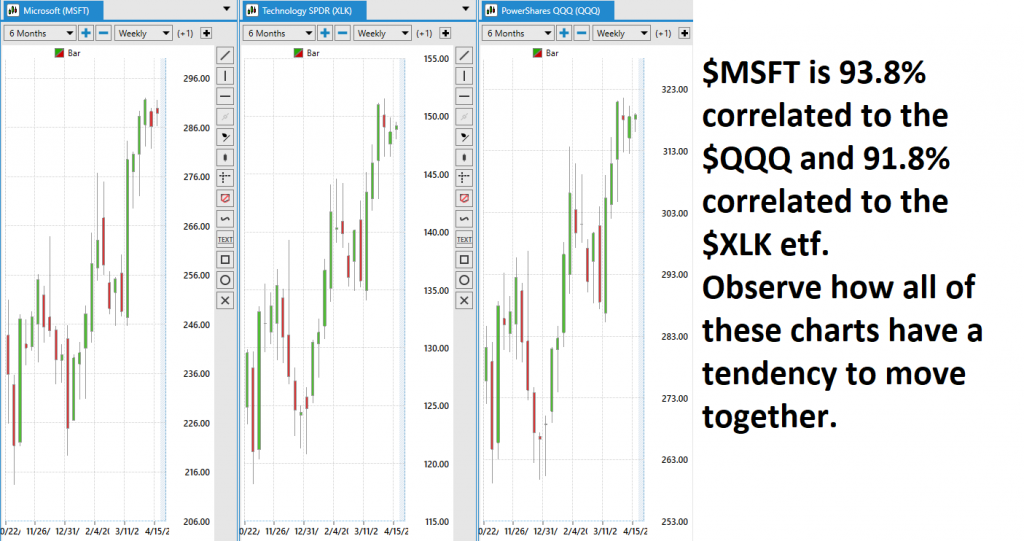
$MSFT represents 10.1% of the weight of the Invesco $QQQ Trust and roughly 21.4% of the weighting of the Technology Select Sector SPDR $XLK. Observe the performance metrics below for these three different assets.
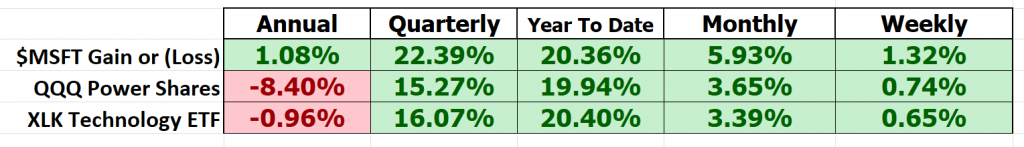
What we can conclude is that as goes $MSFT so goes the tech sector. It clearly appears that when economic growth, innovation and low interest rates occur these are all positive factors for the tech sector. However, economic slowdowns, supply chain disruptions and cybersecurity risks are all negative for the tech sector.
Vantagepoint A.I. Forecast (Predictive Blue Line)
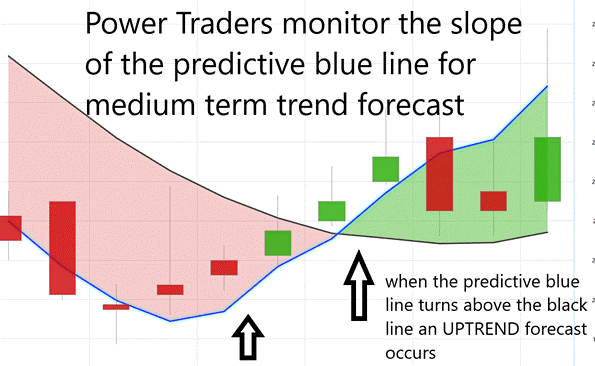
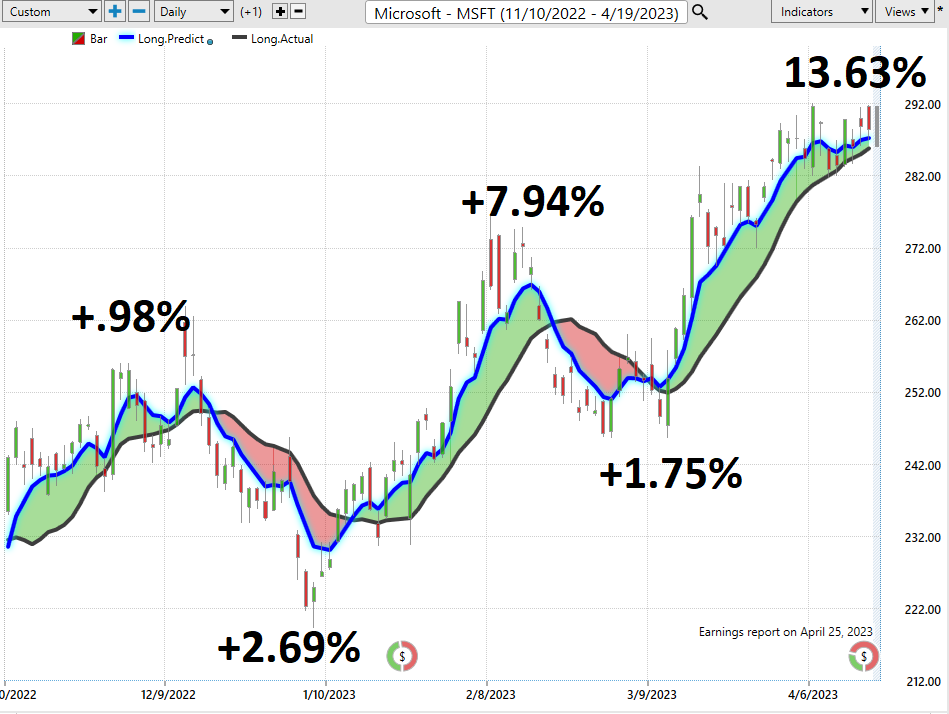
On the following chart you will see the power of the VantagePoint Predictive blue line which determines the medium-term trend price forecast.
The guidelines we abide by are as follows:
- The slope of the predictive blue line determines the trend forecast and general direction of $MSFT
- Ideally, the VALUE ZONE is determined to try and find buy opportunities at or below the predictive blue line, or to sell opportunities above the predictive blue line during a downtrend.
Naturally when the predictive blue line slopes lower traders would be anticipating lower prices and either moving to the sidelines or hedging their positions.
Using VantagePoint Software and the artificial intelligence, traders are alerted to trend forecasts by monitoring the slope of the predictive blue line.
Over the last 5 months there have been 5 a.i. trend forecasts on $MSFT. They have all been profitable. Cumulatively they have generated 26.96%. On average each trade generated a profit of 5.39%.
The predictive blue line, utilizes the VantagePoint-patented Neural Network and Intermarket Analysis to arrive at its value. It looks at the strongest price drivers of an asset through artificial intelligence and statistical correlations to determine its value.
The blue line ALWAYS determines the forecast and the best move forward.
Neural Network Indicator (Machine Learning)
The chart below includes a Neural Network Indicator that predicts short-term market strength and weakness. When the Neural Net Indicator is green, it indicates strength; when it is red, it indicates short-term weakness; and when it is yellow, it suggests sideways prices. A Neural Net is a learning system that uses a network of functions to process large amounts of data and improve its performance. It simulates the human brain and consists of nodes or neurons that exchange and convert information, resulting in accurate predictions of changes and trends in the market.
Neural networks have become popular with financial traders as they can help make better trading decisions by considering external factors like technical variables such as volume and volatility. These sophisticated networks save time by automating data analysis and offering high probability forecasts based on historical information, making them suitable for both manual and automated trading strategies across various asset classes.
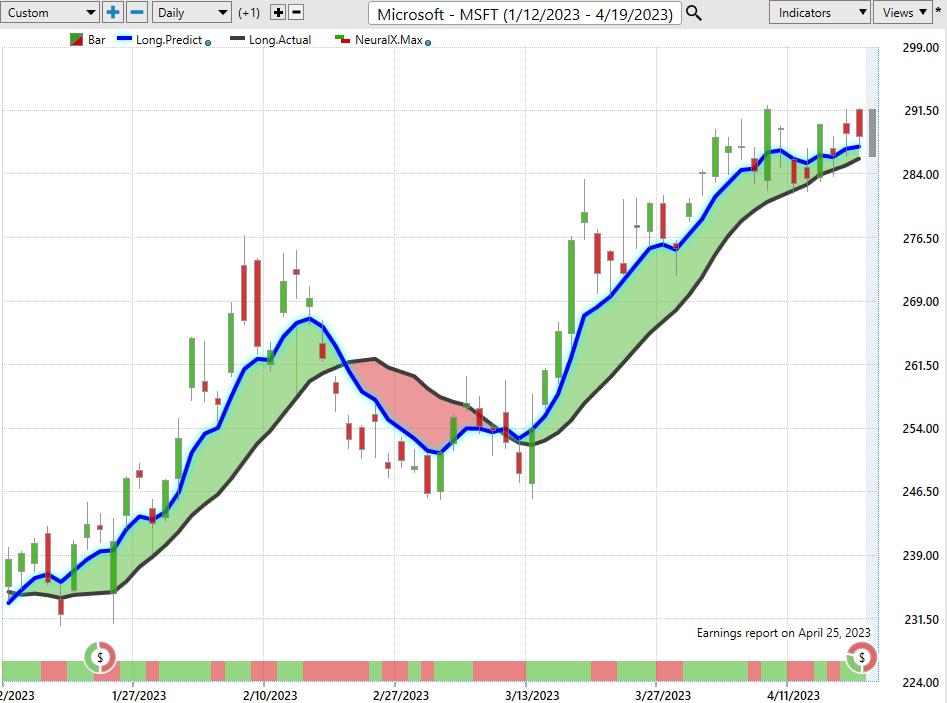
Power Traders are encouraged to cross-reference the chart with the predictive blue line and neural network indicator to create optimal entry and exit points. For serious traders, neural networks offer a next-generation trading tool that detects subtle patterns that traditional methods of technical analysis cannot uncover. Traders look for confirmation on Neural Net to position themselves LONG or SHORT in the market. When the A.I. forecast is green and the Neural Net is green, it presents a buying opportunity, while the opposite is true for selling opportunities. The chart includes arrows that highlight trading zones where Power Traders would have used double confirmation to buy or sell by cross-referencing the A.I. forecast with the Neural Net.
Power Traders are always looking to apply both the Neural Network and A.I. to the markets to find statistically sound trading opportunities.
Vantagepoint A.I. Daily Range Forecast
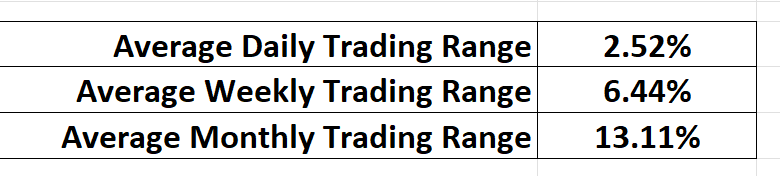
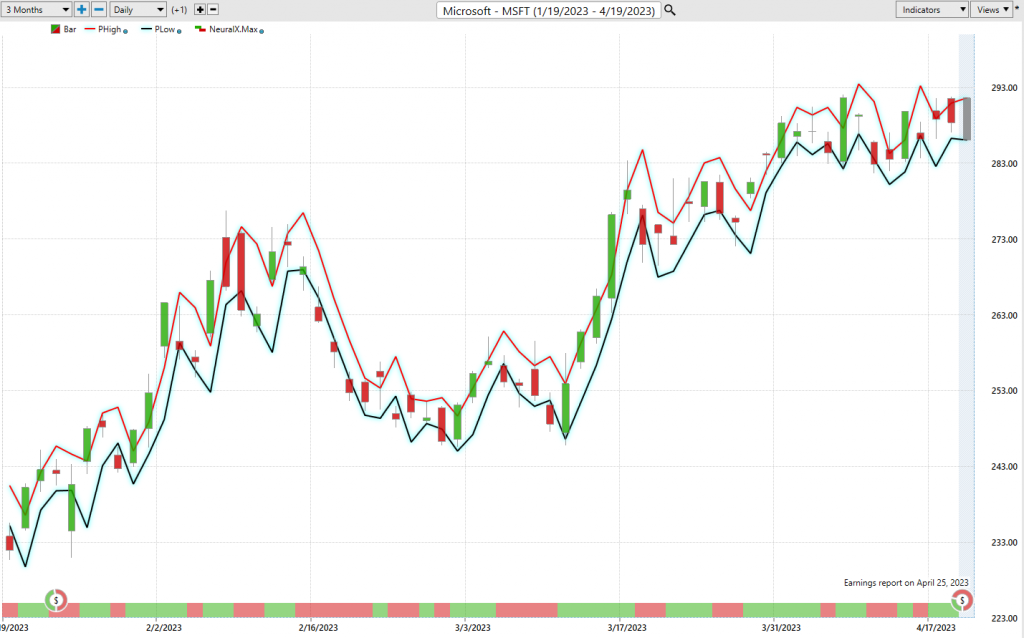
Let’s take a closer look at the past three months of price action to demonstrate how the combination of AI and machine learning results in an accurate daily price range forecast that helps traders place optimal trades. But before we do that, let’s examine the average trading ranges for $MSFT on the daily, weekly, and monthly time frames. This provides insight into the market’s typical behavior over these periods.
VantagePoint Software, which Power Traders use daily, includes a powerful feature called the Price Range prediction forecast. This forecast allows Power Traders to fine-tune their market entries and exits with great accuracy.
Traders often face daily anxiety and frustration as they try to determine when to buy and sell in the market. VantagePoint’s AI makes this decision simple with the Daily Price Range Forecast, which provides a clear channel of trading activity between the upper and lower bands of the price range forecast. Swing traders can identify buying opportunities at the bottom of the predicted channel and aim to sell above the top band.
Intermarket Analysis
In trading, power lies in how we respond to the truth we understand. One of the most important questions we need to ask ourselves is what’s driving the price? Headlines are just stories that capture the imagination, but we need to understand the cause and effect of price movements. The only way to answer this question is through intermarket analysis that looks at statistical price correlations of assets.
Intermarket analysis is an important tool that allows us to analyze data from different asset classes to identify correlations or trends that may indicate future market movements. As traders, we need to stay ahead of the curve and capitalize on markets, and intermarket analysis gives us the insight we need to make informed decisions. We can see where specific assets correlate with each other, as well as economic news, to gain insight into how trends may develop in the near future.
Intermarket analysis is a great tool for investors and traders looking to determine the key price drivers of an asset. It involves considering the relationships between different markets to identify correlations that could affect the price of an asset. Understanding how changes in one market can impact on another market allows us to anticipate where prices may go and make more informed decisions.
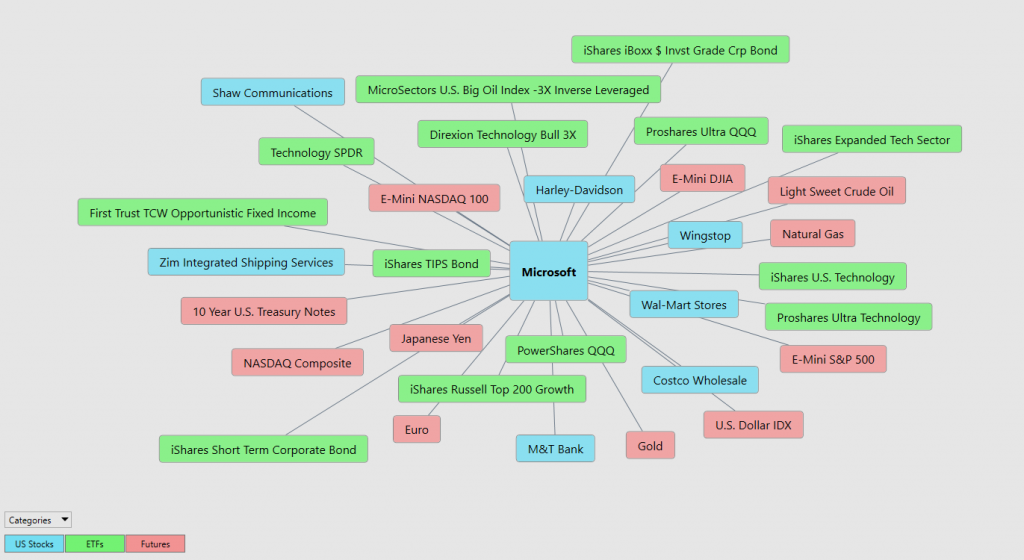
Within the Intermarket Analysis graphic, we can see the 31 markets that are the key drivers to $MSFT’s price. There’s great value in studying and understanding the key drivers of $MSFT’s price action, and this graphic provides a microcosmic view of what factors have been driving it higher. We can also see a handful of biotech and pharmaceutical ETFs whose price action is very statistically correlated to $MSFT. As traders, we always have a choice. We can rely on facts to base our decision making on or tune in to the talking heads in the media who spin talking points that promote fear.
Our Suggestion
Which corporate titan will dominate the A.I. industry? The two main contenders are Google and Microsoft, but in this battle, size matters. In our estimation this is one of the reason $MSFT stock has rallied as of late.
Microsoft has been investing in OpenAI since 2019, giving them first strike advantage with the launch of ChatGPT. This partnership has already reaped benefits from OpenAI’s A.I. research. Plus, Microsoft’s Azure is the exclusive cloud provider for OpenAI, which means as the popularity of ChatGPT and other OpenAI applications grows, Azure will land more business.
The next earnings date for $MSFT is April 25, 2023 and it will be a key driver of the future price trend for the second quarter. Expectations are $2.22 per share. Should this number be beaten we think it will allow the stock to first consolidate and then march higher.
Many of Microsoft’s applications are already iconic, and they have many uses for their AI between their Windows operating system, their Office product suite, and LinkedIn. Users are already familiar with their products, so they can integrate new A.I. features into them in a user-friendly, non-threatening manner.
In summary, Microsoft is likely to be the early-round leader in the battle for A.I. dominance. But regardless, it’s already an excellent stock to own and trade, with diversified business segments, a strong history of revenue and earnings growth, and an outstanding management team. And now, we can add their growing clout within the A.I. industry to the long list of reasons to own Microsoft stock.
Our recommendation is to follow the A.I. trend analysis as outlined in this stock study and practice good money management on all trades. With a 2.5% average daily trading range there is plenty of short term swing trading opportunity.
We will re-evaluate daily based upon:
- New Wall Street Analysts’ Estimates
- New 52-week high and low boundaries
- Vantagepoint A.I. Forecast (Predictive Blue Line)
- Neural Network Forecast
- Daily Range Forecast
The trend in $MSFT is UP. We will look to the bottom of the daily range forecast to position ourselves LONG with tight stops for short-term trades.
Let’s Be Careful Out There!
It’s Not Magic.
It’s Machine Learning.

IMPORTANT NOTICE!
THERE IS SUBSTANTIAL RISK OF LOSS ASSOCIATED WITH TRADING. ONLY RISK CAPITAL SHOULD BE USED TO TRADE. TRADING STOCKS, FUTURES, OPTIONS, FOREX, AND ETFs IS NOT SUITABLE FOR EVERYONE.
DISCLAIMER: STOCKS, FUTURES, OPTIONS, ETFs AND CURRENCY TRADING ALL HAVE LARGE POTENTIAL REWARDS, BUT THEY ALSO HAVE LARGE POTENTIAL RISK. YOU MUST BE AWARE OF THE RISKS AND BE WILLING TO ACCEPT THEM IN ORDER TO INVEST IN THESE MARKETS. DON’T TRADE WITH MONEY YOU CAN’T AFFORD TO LOSE. THIS ARTICLE AND WEBSITE IS NEITHER A SOLICITATION NOR AN OFFER TO BUY/SELL FUTURES, OPTIONS, STOCKS, OR CURRENCIES. NO REPRESENTATION IS BEING MADE THAT ANY ACCOUNT WILL OR IS LIKELY TO ACHIEVE PROFITS OR LOSSES SIMILAR TO THOSE DISCUSSED ON THIS ARTICLE OR WEBSITE. THE PAST PERFORMANCE OF ANY TRADING SYSTEM OR METHODOLOGY IS NOT NECESSARILY INDICATIVE OF FUTURE RESULTS. CFTC RULE 4.41 – HYPOTHETICAL OR SIMULATED PERFORMANCE RESULTS HAVE CERTAIN LIMITATIONS. UNLIKE AN ACTUAL PERFORMANCE RECORD, SIMULATED RESULTS DO NOT REPRESENT ACTUAL TRADING. ALSO, SINCE THE TRADES HAVE NOT BEEN EXECUTED, THE RESULTS MAY HAVE UNDER-OR-OVER COMPENSATED FOR THE IMPACT, IF ANY, OF CERTAIN MARKET FACTORS, SUCH AS LACK OF LIQUIDITY. SIMULATED TRADING PROGRAMS IN GENERAL ARE ALSO SUBJECT TO THE FACT THAT THEY ARE DESIGNED WITH THE BENEFIT OF HINDSIGHT. NO REPRESENTATION IS BEING MADE THAT ANY ACCOUNT WILL OR IS LIKELY TO ACHIEVE PROFIT OR LOSSES SIMILAR TO THOSE SHOWN.

