
Novartis ($NVS) was founded through the merger of two pharmaceutical companies in 1996. They were Ciba-Geigy and Sandoz. Today Novartis is heavily involved in the research, development, and manufacturing of pharmaceuticals, eyecare products and generics. They have approximately 110,000 employees worldwide and are headquartered in Basel, Switzerland. Their main competitors include Pfizer, Roche, Johnson and Johnson, Sanofi, and AstraZeneca.
$NVS’s most popular and highest-grossing drugs include:
Cosentyx: An injectable biologic drug used to treat various inflammatory diseases such as psoriasis, psoriatic arthritis, and ankylosing spondylitis.
Entresto: A drug used to treat heart failure. It works by relaxing blood vessels and improving blood flow.
Gilenya: An oral medication used to treat multiple sclerosis.
Lucentis: An injectable drug used to treat age-related macular degeneration, diabetic macular edema, and other eye diseases.
Tasigna: An oral medication used to treat chronic myeloid leukemia.
In this stock study we will look at the following metrics and indicators.
- Wall Street Analysts’ Estimates
- 52-week high and low boundaries
- Best Case – Worst Case Analysis
- Vantagepoint A.I. Forecast (Predictive Blue Line)
- Neural Network Forecast
- Daily Range Forecast
- Intermarket Analysis
- Our trading suggestion
We don’t base our decisions on things like earnings or fundamental cash flow valuations. However, we do look at them to better understand the financial landscape that a company is operating under.
Analysts Ratings
The first set of boundaries which we explore in our stock study is what do the professionals think who monitor the stock for a living. We can acquire this information by simply looking at the boundaries that the top Wall Street Analysts set for $NVS. This initial set of boundaries provides us with an idea of what is expensive, fairly valued, and cheap.
The 16 analysts offering 12-month price forecasts for Novartis AG have a median target of 105.06, with a high estimate of 121.04 and a low estimate of 89.52. The median estimate represents a +0.97% increase from the last price of 104.05.
From this simple analysis we can see that $NVS is fairly valued at present time but some on Wall Street think that is has the potential to run another $16
52-week High-Low Chart
As traders, it’s crucial to get down to the nitty-gritty of a stock’s performance. This means examining the charts and identifying the asset’s position relative to its 52-week highs. This is where the rubber meets the road in terms of analysis – it separates the weak from the strong. Contrary to popular belief, the best-performing stocks tend to consistently establish new 52-week highs. This indicates that the market is optimistic about their potential, and investors are bullish on their prospects.
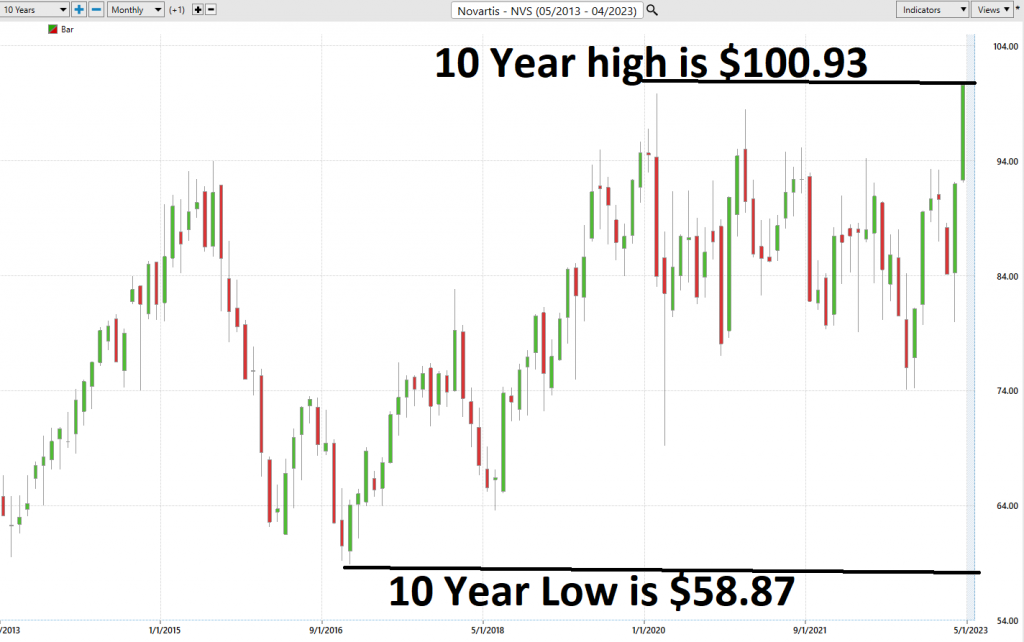
Assessing a stock’s potential can be like peering through a microscope to gain a closer look at its inner workings. One of the simplest and most effective ways to evaluate a stock’s trajectory is to examine long-term monthly and weekly charts. By zooming out and examining the big picture of a stock’s trend, traders can identify patterns and gain valuable insights into its direction. Many of the world’s most successful traders use longer-term monthly charts to inform their trend analysis, recognizing that it provides a comprehensive view of a stock’s performance and allows them to make informed decisions based on a range of factors.
Over the last 52 weeks $NVS has traded as high as $105.56 and as low as $74.09. It is currently trading at its 95th percentile of its 52-week trading range.
We also like to divide the annual range (31.47) by the current price ($104.04) to provide us with a very broad estimate of volatility. Currently the statistical volatility is $30.2%. This metric tells us that if the future behaves like the recent past it would have a very high probability for $NVS over the next year, to be trading in a range that is 30.2% higher and lower from where it is right now.
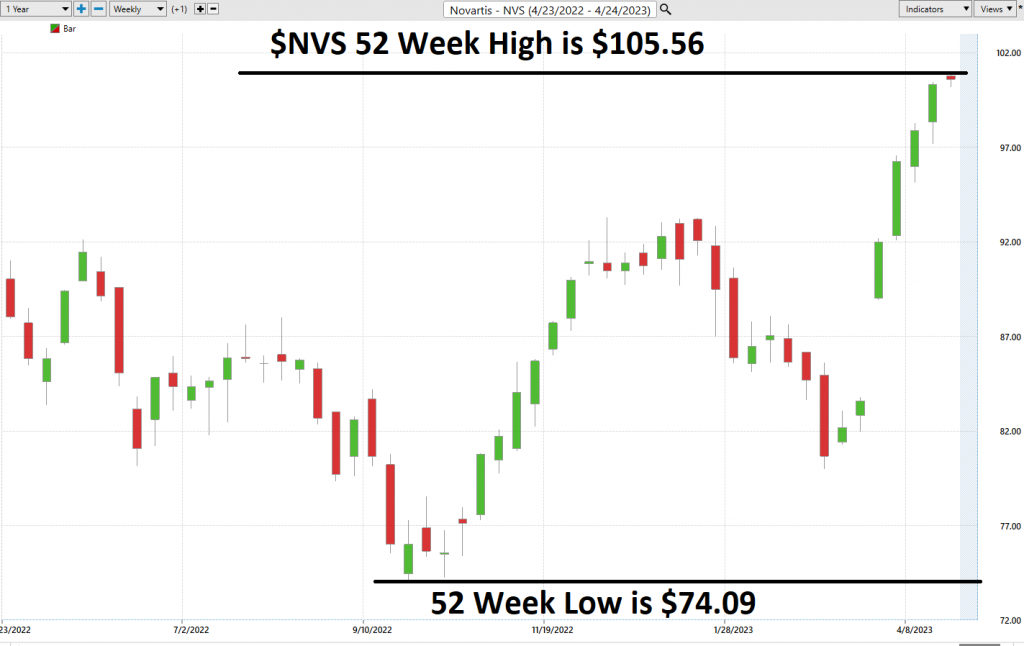
As savvy traders, we always keep a keen eye on our position within the 52-week trading range. It is a well-known fact that the 52-week high can often present a formidable hurdle for the market, until it is surpassed. In fact, it is not uncommon for stocks to experience a rapid and substantial surge in price shortly after breaching this critical threshold.
Stocks that repeatedly break through their 52-week highs multiple times within a given year tend to be in a robust trend and are therefore of great interest to us. The 52-week mark frequently acts as a significant resistance level that can thwart momentum, requiring us to stay laser-focused on the signals generated by our artificial intelligence forecasts.
To help us quickly assess a stock’s performance history and how it aligns with the views of professional analysts, we like to plot these key boundaries, as well as Wall Street estimates, on a chart. This visual representation allows us to gain valuable insights and make informed decisions about our trades.
What is very exciting to us about $NVS’s price action is that it is making new 52-week highs while simultaneously also making new 10-year highs. One truth we have learned about trading the financial markets is to always pay attention to stocks that are making new 10-year highs. It shows that they are overcoming the obstacles that they have been forced to confront over the past decade.
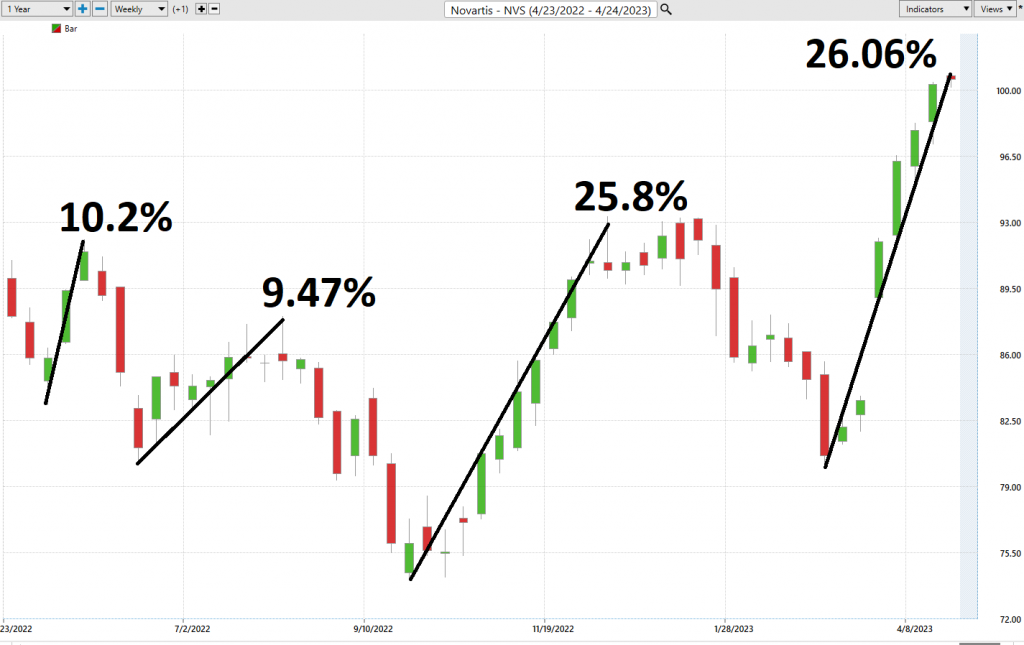
Best Case – Worst Case Analysis
Next, we like to step out of the theoretical and into real world performance and results. What we consider vitally important before undertaking any trade is to be fully aware as to how the rallies over the past year have compared to the declines. By doing this we get to compare the real-world price action and understand the volatility of $NVS.
To accomplish this objective, we simply connect the peaks to the toughs and measure the rallies against the declines.
First the best-case analysis:
Followed by the worst-case analysis:
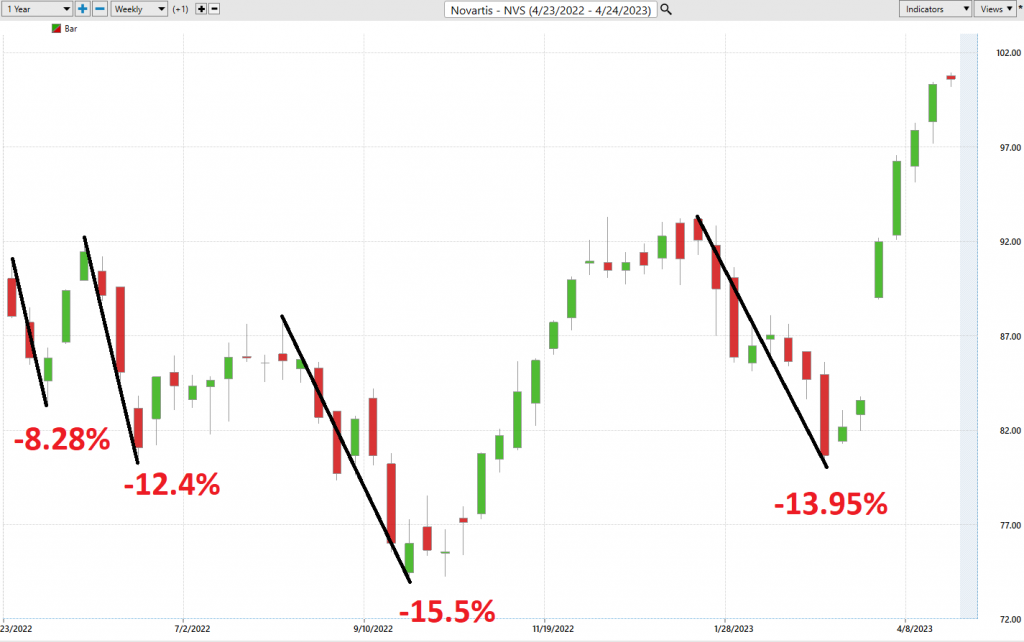
You can quickly observe the level of risk and opportunity by doing this analysis on your own any time you trade.
Lastly, we compare the performance of $NVS to the broader stock market indexes.
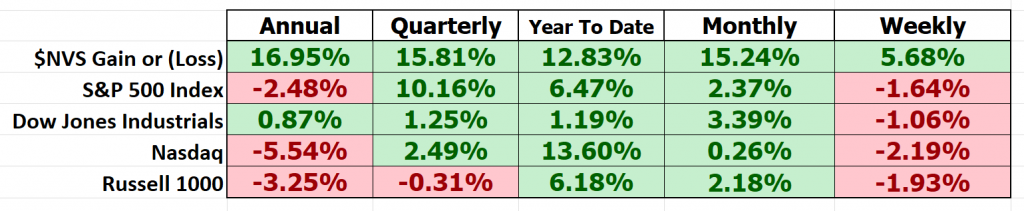
Clearly, $NVS massively outperformed the broader stock market indexes across all major important time frames.
Finally, we compare $NVS to its major competitors in the Pharmaceutical sector and to the SPDR S&P Biotech ETF ($XBI).
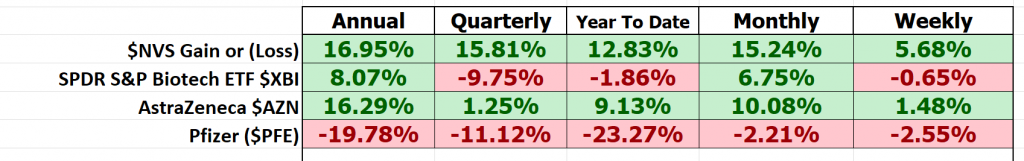
When I study this performance, I conclude the $NVS clearly is an alpha stock. It has soundly beaten the performance of all the broader stock market indexes as well as its competitors in the pharmaceutical sector and Biotech ETF
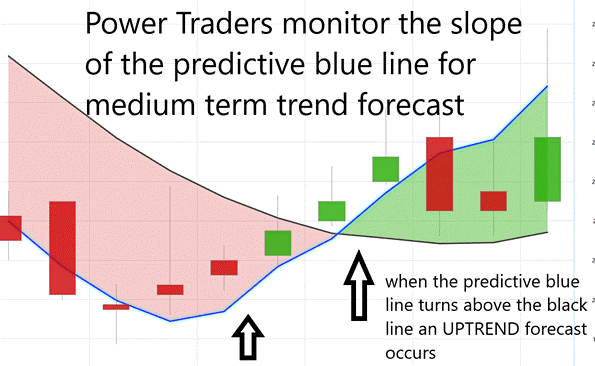
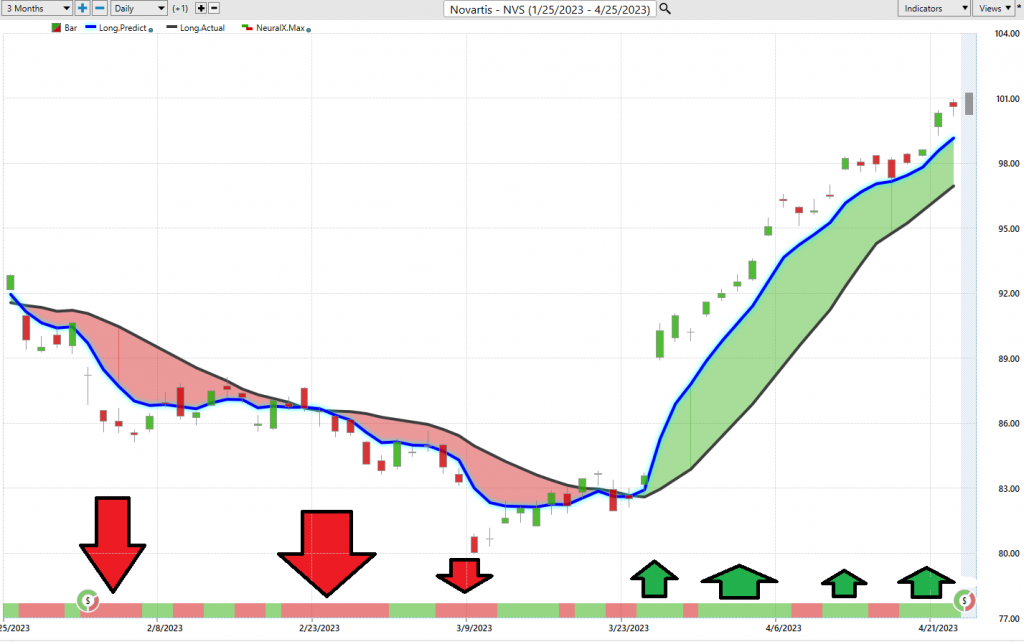
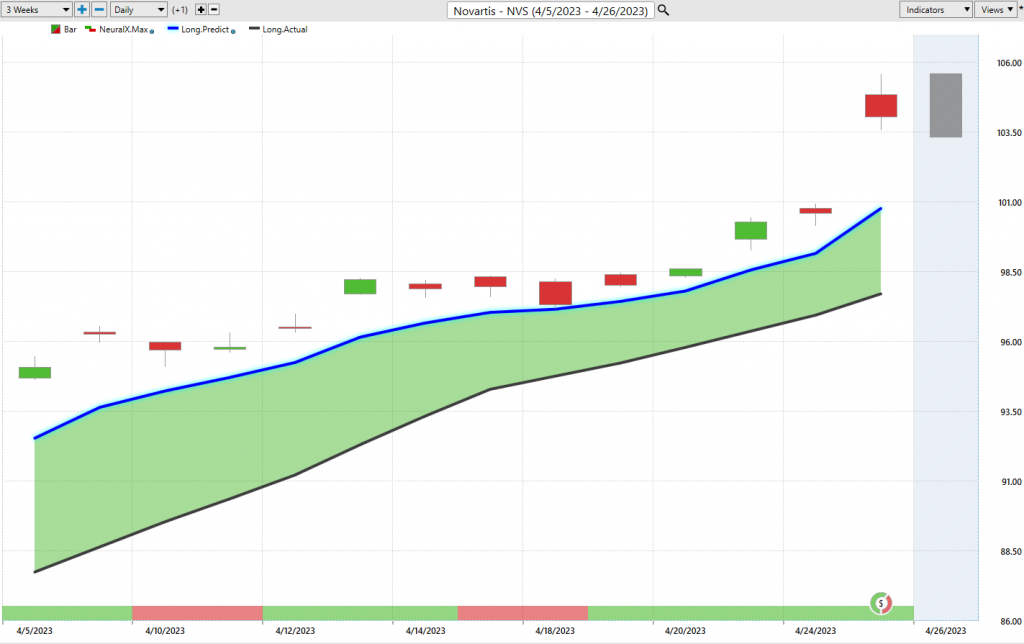
Using VantagePoint Software and the artificial intelligence, traders are alerted to trend forecasts by monitoring the slope of the predictive blue line. The black line is a simple 10-day moving average of price which simply tells you what has occurred in the market. The predictive blue line also acts as a value zone where in uptrends traders try to purchase the asset at or below the blue line.
In studying the chart below, pay close attention to the relationship between the black line and predictive blue line. All that the black line tells you is what has occurred. It tells you where prices have been and what the average price over the last ten days is.
The predictive blue line, on the other hand utilizes the Vantagepoint patented Neural Network and Intermarket Analysis to arrive at its value. It looks at the strongest price drivers of an asset through artificial intelligence and statistical correlations to determine its value.
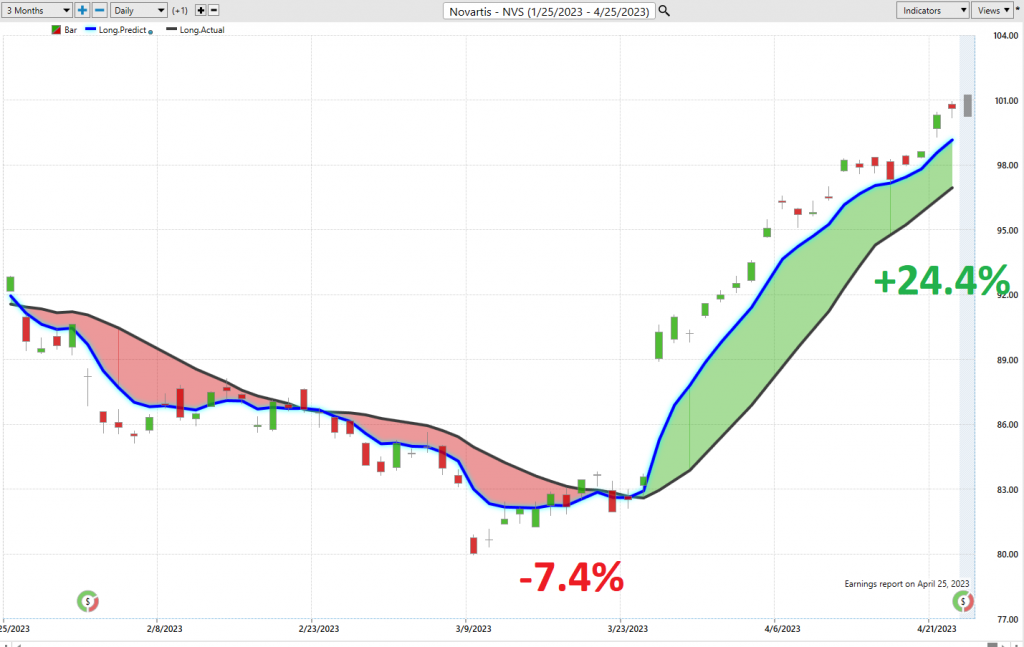
We will analyze the last three months for $NVS stock so you can appreciate the power of the artificial intelligence in a real time trading situation.
Whenever we see the predictive blue line move above the black line, we are presented with an UP-forecast entry opportunity. These are highlighted by UP arrows on the chart.
Whenever the predictive blue line moves below the black line, we are presented with a DOWN forecast entry opportunity. More importantly, there is no guesswork involved. Traders know where the value zone and trend are at all times.
Over the last 3 months there were two distinct a.i. trend forecasts.
The first generated 7.4% gains on the short side of the market.
The second has generated 24.4% gains on the long side.
Fine Tuning Entries with The Neural Net Indicator
The Neural Network Indicator is a powerful tool that can help traders identify future market strength or weakness. When the indicator is green, it signals strength, while red indicates short-term weakness. We encourage Power Traders to use this tool in conjunction with the predictive blue line to optimize their entry and exit points.
A Neural Net is an advanced computational learning system that utilizes a network of functions to analyze vast amounts of data and produce a desired output. It is constantly self-monitoring and improving its performance, making it a valuable asset in the trading world.
Power Traders are always on the lookout for statistically sound trading opportunities, utilizing both the neural network and artificial intelligence to identify profitable trades. By using a “double confirmation” setup, where the predictive blue line and Neural Net align, traders can maximize their chances of success.
We advise Power Traders to pay close attention to the slope of the predictive blue line and its alignment with the Neural Net. In the chart above, we can see how the Neural Net provided several double confirmation opportunities, where the predictive blue line and Neural Net aligned with the same forecast, presenting high probability trading opportunities to exploit the trend.
By staying attuned to the Neural Network Indicator and utilizing the predictive blue line, Power Traders can stay ahead of the curve and identify profitable trading opportunities.
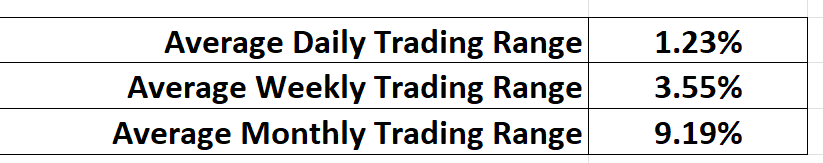
VantagePoint Software Daily Price Range Prediction
One of the powerful features in the Vantagepoint A.I. Software which Power Traders use daily is the Daily Price Range prediction forecast.
This forecast is what permits Power Traders to truly fine tune their entries and exits into the market.
Over the past year here are the average trading ranges for the monthly, weekly, and daily time frames.
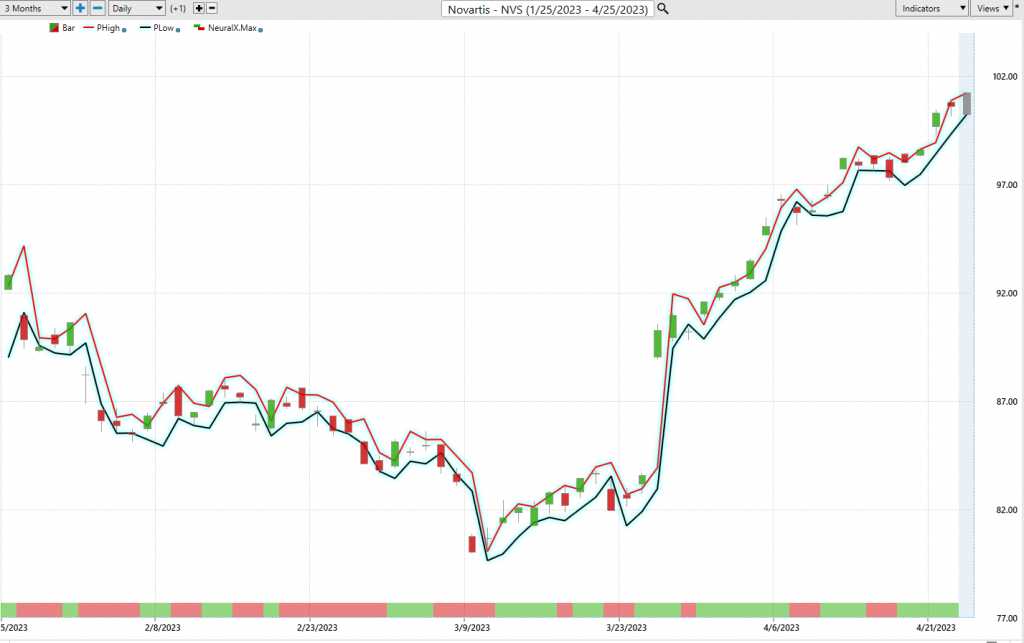
Here is the price chart of $NVS during the most recent two-month runup featuring the Daily Price Range forecast and the Neural Net Indicator.
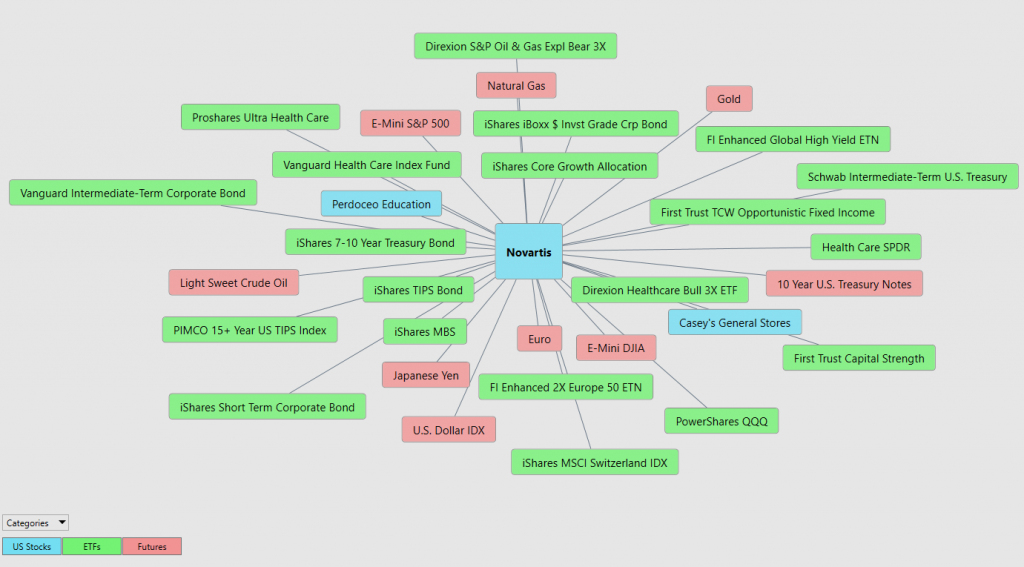
Intermarket Analysis
The Vantagepoint Software is gaining attention among traders for its unique ability to conduct Intermarket analysis and identify the assets that have the strongest statistical correlations and serve as key drivers of prices. While chart analysis can offer insights into locating support and resistance levels, the global marketplace demands a more comprehensive approach, considering how everything is interconnected. Thus, the billion-dollar question for traders remains: what are the key drivers of price for the underlying asset they are trading? These intangibles are invisible to the naked eye, but they exhibit high statistical correlations. Fluctuations in interest rates, crude oil prices, and the volatility of the dollar, among other variables, have a profound impact on business decisions in these challenging times. Investors and traders alike face the daunting task of identifying these factors. The key drivers of $NVS price movement, for instance, hold great value for traders, as it can reveal the ETFs most likely to acquire $NVS and other industries that impact its price movement.
Suggestion
$NVS has had an incredible run over the last month.
As we have shown it has outperformed the broader stock market indexes. It has also outperformed its competitors.
This asset could go much higher but at the present time we would expect the stock to revert to a few points below the value zone identified by the predictive blue line.
The trend is UP.
Momentum is UP.
The predictive blue line is the guidance that we will be following. Wall Street Analysts are slowly revising their estimates upward. On its most recent earnings call it beat earnings estimates by 11.29% and beat revenue by 2.81%.
Our advice: Follow the a.i. trend analysis and practice good money management on all your trades. The chart looks very strong on $NVS particularly since it has made new 10-year highs. We will be looking at short-term swing trading opportunities on the long side. We expect the pullback to be brief.
We will re-evaluate this analysis based upon:
- Wall Street Analysts’ Estimates
- 52-week high and low boundaries
- Vantagepoint A.I. Forecast (Predictive Blue Line)
- Neural Network Forecast
- Daily Range Forecast
- Intermarket Analysis
Let’s Be Careful Out There!
Remember, It’s Not Magic.
It’s Machine Learning.

IMPORTANT NOTICE!
THERE IS SUBSTANTIAL RISK OF LOSS ASSOCIATED WITH TRADING. ONLY RISK CAPITAL SHOULD BE USED TO TRADE. TRADING STOCKS, FUTURES, OPTIONS, FOREX, AND ETFs IS NOT SUITABLE FOR EVERYONE.
DISCLAIMER: STOCKS, FUTURES, OPTIONS, ETFs AND CURRENCY TRADING ALL HAVE LARGE POTENTIAL REWARDS, BUT THEY ALSO HAVE LARGE POTENTIAL RISK. YOU MUST BE AWARE OF THE RISKS AND BE WILLING TO ACCEPT THEM IN ORDER TO INVEST IN THESE MARKETS. DON’T TRADE WITH MONEY YOU CAN’T AFFORD TO LOSE. THIS ARTICLE AND WEBSITE IS NEITHER A SOLICITATION NOR AN OFFER TO BUY/SELL FUTURES, OPTIONS, STOCKS, OR CURRENCIES. NO REPRESENTATION IS BEING MADE THAT ANY ACCOUNT WILL OR IS LIKELY TO ACHIEVE PROFITS OR LOSSES SIMILAR TO THOSE DISCUSSED ON THIS ARTICLE OR WEBSITE. THE PAST PERFORMANCE OF ANY TRADING SYSTEM OR METHODOLOGY IS NOT NECESSARILY INDICATIVE OF FUTURE RESULTS. CFTC RULE 4.41 – HYPOTHETICAL OR SIMULATED PERFORMANCE RESULTS HAVE CERTAIN LIMITATIONS. UNLIKE AN ACTUAL PERFORMANCE RECORD, SIMULATED RESULTS DO NOT REPRESENT ACTUAL TRADING. ALSO, SINCE THE TRADES HAVE NOT BEEN EXECUTED, THE RESULTS MAY HAVE UNDER-OR-OVER COMPENSATED FOR THE IMPACT, IF ANY, OF CERTAIN MARKET FACTORS, SUCH AS LACK OF LIQUIDITY. SIMULATED TRADING PROGRAMS IN GENERAL ARE ALSO SUBJECT TO THE FACT THAT THEY ARE DESIGNED WITH THE BENEFIT OF HINDSIGHT. NO REPRESENTATION IS BEING MADE THAT ANY ACCOUNT WILL OR IS LIKELY TO ACHIEVE PROFIT OR LOSSES SIMILAR TO THOSE SHOWN.

