

This week’s stock analysis is NVIDIA (NVDA).
NVIDIA chips are deployed in supercomputing sites around the world. The company has moved into the mobile computing market, where it produces Tegra mobile processors for smartphones and tablets as well as vehicle navigation and entertainment systems. In addition to AMD, its competitors include Intel and Qualcomm.
What makes NVIDIA very exciting is how well diversified the company is in multiple growth industries. The company has created a competitive leadership role in the electric and autonomous driving niche, the datacenter and cloud, graphics, computational power, A.I. and machine learning, drones and robots as well as crypto mining — the list goes on and on.
Analysts Ratings
The 35 analysts offering 12-month price forecasts for NVIDIA Corp have a median target of $670.00, with a high estimate of $800.00 and a low estimate of $380.00. The median estimate represents a +7.68% increase from the last price of $622.22. VantagePoint Power Traders love to see this type of divergent opinion on a stock that is widely traded.
Nvidia has had huge momentum over the years, it’s become a favorite stock of swing traders. It’s easy to think its best days have already occurred. But that couldn’t be further from the truth.
The demands from the tech world are growing. Computers constantly need to be faster, data continues to expand not shrink and graphics are constantly improving. These are the most basic facts of technology.
NVDA Earnings
No one is going to wake up one day and say, “Man, I wish these graphics were like the good old Radio Shack days.” As microchip technology continues to improve, companies continue to need the best — and Nvidia fits that description.
Amid a global supply shortage for semiconductors, Nvidia figures total revenue for the first quarter will top the $5.3 billion. The video gaming business turned in a stellar performance for NVIDIA last quarter. Gaming revenue shot up 67% year over year to $2.5 billion, accounting for half of the company’s sales. Additionally, cryptocurrency-related demand is also propping up NVIDIA’s gaming business. Citing analyst estimates, the company says that cryptocurrency miners bought graphics cards worth $100 million to $300 million last quarter. It should be stressed that NVIDIA had minted nearly $2 billion in revenue from cryptocurrency-related sales a few years ago, so it will win big as interest in cryptocurrencies continues to grow.
On its most recent earnings call on Feb. 24, Nvidia easily beat estimates for the fourth quarter. Year over year, NVDA earnings rose 64% while sales climbed 61%. Over the last three quarters, Nvidia earnings per share growth averaged 67%, far above the three-year average of 13%. Sales growth has accelerated three straight quarters, capped with a 61% in Q4, well above an average 11% over the past three years.
52 week High Chart
Over the last 52 weeks NVDA has traded as high as $642.12 and as low as $267.11. This means provides us with an annual trading range of $375.01. When we divide this metric by 52-weeks we can determine that the average weekly trading range for NVDA is roughly $7.21. We refer to these as the commonsense metrics which we use as baseline measurements of understanding normal value. When using artificial intelligence we look to amplify our returns based upon these baseline measurements.
Whenever we trade, we always pay attention to where we are in relation to the 52 week trading range. It’s very common to see the 52 week high provide very strong resistance to the market until it is breached. Often when the 52 week high is breached we will see the stock price explode higher very quickly over a very short period of time.
On Wall Street everybody wants to buy low and sell high. However, in strong trending markets you often are required to buy high and sell higher.
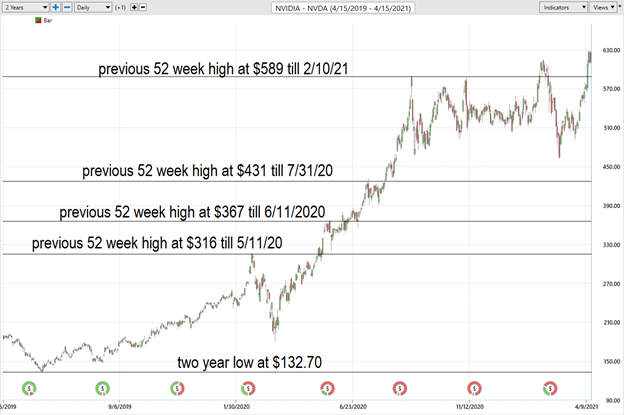
The adage in trading that is very workable is that old resistance becomes new support. This perspective worked extremely well in navigating NVDA over the last year.
We strongly advise that traders pay primary attention to where we are in the 52 week trading range whenever we look to trade a stock. NVDA appears to have new long-term support at the most recent 52 week high which was recently breached.
The Vantagepoint A.I. Analysis
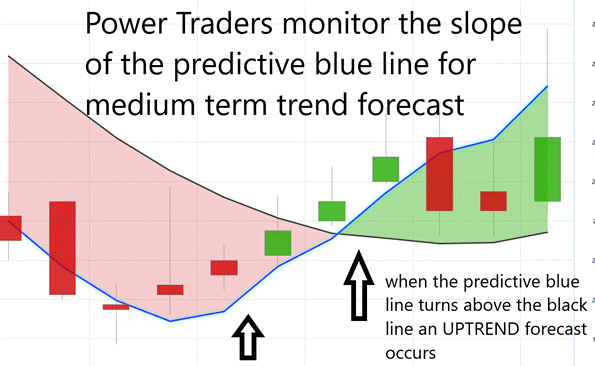
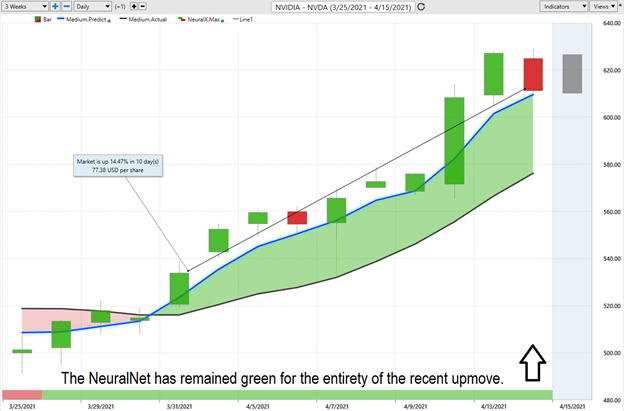
Using VantagePoint Software and the artificial intelligence, traders are alerted to trend forecasts by monitoring the slope of the predictive blue line. The black line is a simple 10 day moving average of price which simply tells you what has occurred in the market. The predictive blue line also acts as value zone where in uptrends traders try to purchase the asset at or below the blue line.
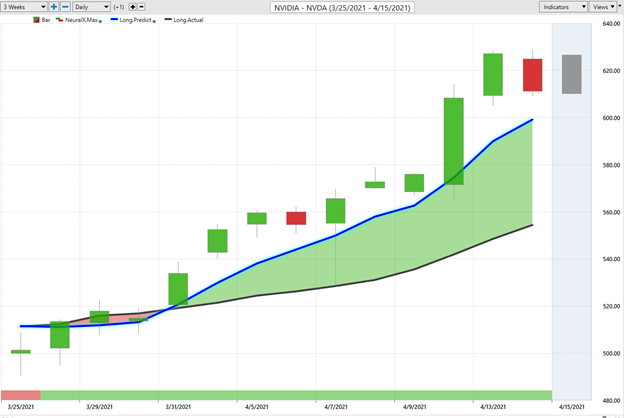
In studying the chart above pay close attention to the relationship between the black line and predictive blue line. The black line is just a simple 10 day moving average. It’s calculated by taking the closing prices of the last 10 days and dividing that sum by 10. All that the black line tells you is what has occurred. It tells you where prices have been and what the average price over the last ten days is.
The predictive blue line, on the other hand utilizes that Vantagepoint patented Neural Network and Intermarket Analysis to arrive at its value. It looks at the strongest price drivers of an asset through artificial intelligence and statistical correlations to determine its value.
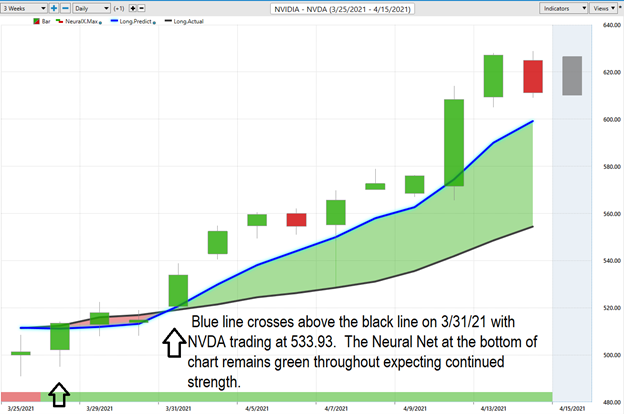
Whenever we see the predictive blue line move above the black line we are presented with an UP entry opportunity. This is what occurred on March 31st, 2021 @ $533.93 per share.
Power traders use the predictive blue line in helping to determine both the value zone as well as the trend direction.
Observe how the SLOPE of the predictive bleu line started moving higher a few days previous to its moving above the black line. Over the last ten trading sessions NVDA has moved up 14.47% or $77.38 per share. This is far above the weekly norms for this asset.
Fine Tuning Entries With The Neural Net Indicator
At the bottom of the chart is the Neural Network Indicator which predicts future strength and/or weakness in the market. When the Neural Net Indicator is Green it communicates strength. When the Neural Net is Red it is forecasting short term weakness in the market.
We advocate that Power Traders cross reference the chart with the predictive blue line and neural network indicator to create optimal entry and exit points.
Power Traders are always looking to apply both the neural network and A.I. to the markets to find statistically sound trading opportunities.
VantagePoint Software Daily Price Range Prediction
One of the powerful features in the Vantagepoint A.I. Software which Power Traders use on a daily basis is the Daily Price Range prediction forecast.
This forecast is what permits Power Traders to truly fine tune their entries and exits into the market.
Here is the price chart of NVDA during the most recent runup featuring the Daily Price Range forecast and the NeuralNet Indicator.
In summary, the trend turned up. Prices have surged since that forecast and the trend remain firmly UP. Traders have had numerous opportunities to purchase NVDA towards the lower end of the daily price forecast to fine tune their entries.
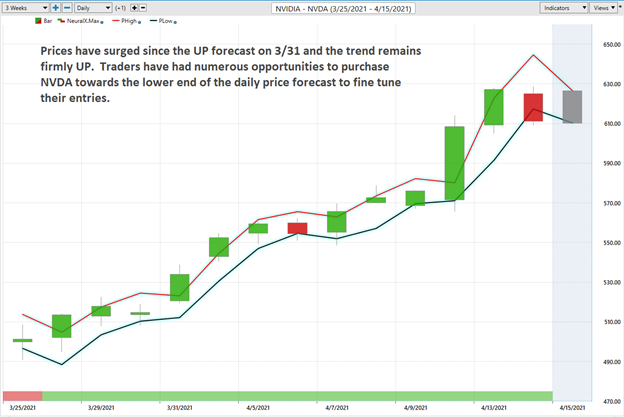
Power Traders use a price level below the predictive low price to place their protective sell stops in the market in case a sudden reversal was to occur.
Observe how the predictive price low also provided numerous short term entry opportunities for traders to buy NVDA as it was trending higher.
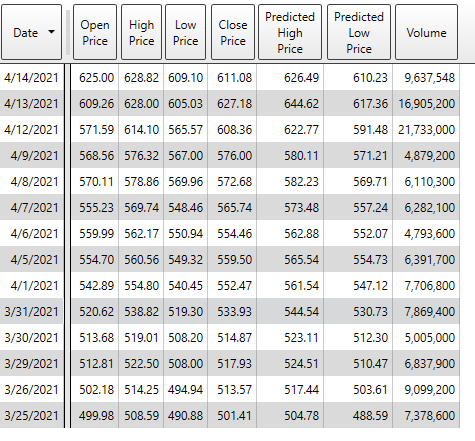
This information can also be presented in a tabular format, including VOLUME which is very helpful for analytical traders who want to add their own flavor to a trading opportunity.
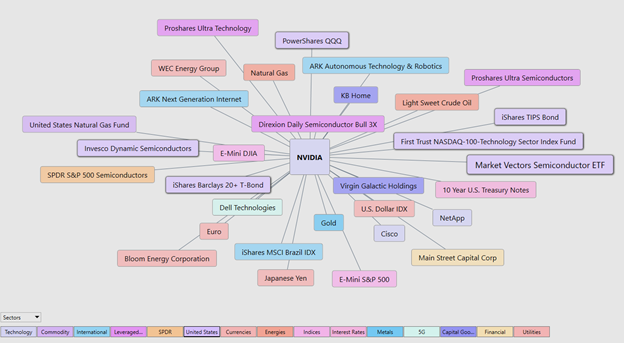
Intermarket Analysis
What makes the Vantagepoint Software truly unique is its ability to perform Intermarket analysis and to locate those assets which are most interconnected that are responsible for driving the price of NVDA higher or lower.
Studying the charts can always provide objective realities in terms of locating support and resistance levels which become very clear on a chart. But we live in a global marketplace. Everything is interconnected. The billion dollar question for traders is always what are the key drivers of price for the underlying asset that I am trading?
These intangibles are invisible to the naked eye yet show very high statistical correlations.
Small changes in Interest rates, Crude Oil Prices, and the Volatility of the dollar amongst thousands of other variables affect the decisions companies must make to survive in these very challenging times. Trying to determine what these factors are is one of the huge problems facing investors and traders.
There is great value to be had in studying and understanding the key drivers of NVDA price action.
By doing so you can often see which ETF’s are most likely acquiring NVDA as well as uncovering other industries which affect NVDA price movement.
Earlier in this study we mentioned how NVDA is creating microchips for the gaming, semiconductor and Electronic Vehicle industries. The key players in these sectors will often show up and present other relevant trading opportunities worth exploring.
Conclusion
NVDA is undervalued at the present time and the trend is firmly up. The consensus of analysts opinions shows that NVDA is fairly valued around $670. Power traders are in at lower prices and are placing their protective stops below the bottom of the predictive low channel. Momentum is very strong on this asset. Since the company continues to outperform on its earnings estimates we think this tailwind may propel prices higher.
NVDA is a great swing trading stock. Always check the current A.I. daily forecast.
Our advice: Follow the A.I. trend analysis and practice good money management on all of your trades.
NVDA deserves to be on your trading radar.
Let’s Be Careful Out There!
Remember, It’s Not Magic.
It’s Machine Learning.

IMPORTANT NOTICE!
THERE IS SUBSTANTIAL RISK OF LOSS ASSOCIATED WITH TRADING. ONLY RISK CAPITAL SHOULD BE USED TO TRADE. TRADING STOCKS, FUTURES, OPTIONS, FOREX, AND ETFs IS NOT SUITABLE FOR EVERYONE.
DISCLAIMER: STOCKS, FUTURES, OPTIONS, ETFs AND CURRENCY TRADING ALL HAVE LARGE POTENTIAL REWARDS, BUT THEY ALSO HAVE LARGE POTENTIAL RISK. YOU MUST BE AWARE OF THE RISKS AND BE WILLING TO ACCEPT THEM IN ORDER TO INVEST IN THESE MARKETS. DON’T TRADE WITH MONEY YOU CAN’T AFFORD TO LOSE. THIS ARTICLE AND WEBSITE IS NEITHER A SOLICITATION NOR AN OFFER TO BUY/SELL FUTURES, OPTIONS, STOCKS, OR CURRENCIES. NO REPRESENTATION IS BEING MADE THAT ANY ACCOUNT WILL OR IS LIKELY TO ACHIEVE PROFITS OR LOSSES SIMILAR TO THOSE DISCUSSED ON THIS ARTICLE OR WEBSITE. THE PAST PERFORMANCE OF ANY TRADING SYSTEM OR METHODOLOGY IS NOT NECESSARILY INDICATIVE OF FUTURE RESULTS. CFTC RULE 4.41 – HYPOTHETICAL OR SIMULATED PERFORMANCE RESULTS HAVE CERTAIN LIMITATIONS. UNLIKE AN ACTUAL PERFORMANCE RECORD, SIMULATED RESULTS DO NOT REPRESENT ACTUAL TRADING. ALSO, SINCE THE TRADES HAVE NOT BEEN EXECUTED, THE RESULTS MAY HAVE UNDER-OR-OVER COMPENSATED FOR THE IMPACT, IF ANY, OF CERTAIN MARKET FACTORS, SUCH AS LACK OF LIQUIDITY. SIMULATED TRADING PROGRAMS IN GENERAL ARE ALSO SUBJECT TO THE FACT THAT THEY ARE DESIGNED WITH THE BENEFIT OF HINDSIGHT. NO REPRESENTATION IS BEING MADE THAT ANY ACCOUNT WILL OR IS LIKELY TO ACHIEVE PROFIT OR LOSSES SIMILAR TO THOSE SHOWN.

