
Over the last six months, we have written extensively about the changing interest rate environment. When we analyze the economic reports released by the monetary authorities, we see that we are in a stagflationary environment. Traditionally this is defined as rising inflation and slowing growth. Stagflation can be a difficult environment for traders because what becomes of paramount importance is trying to preserve purchasing power in the face of rising inflationary currents.
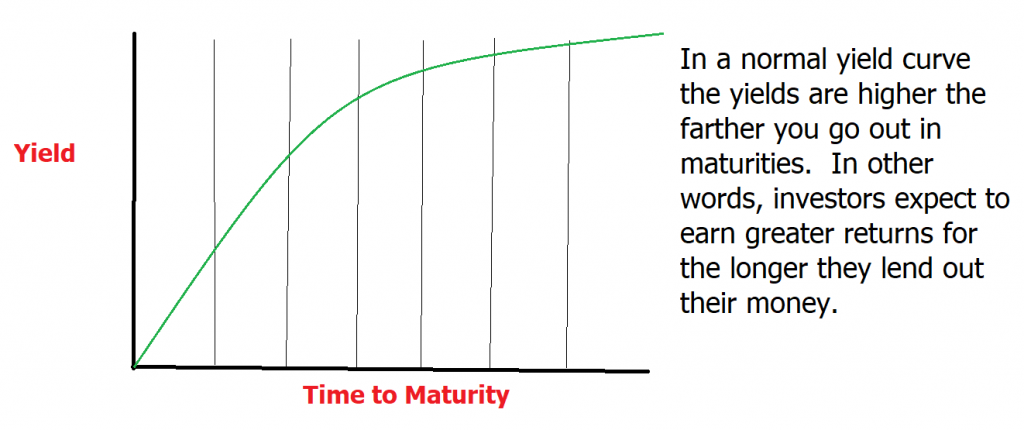
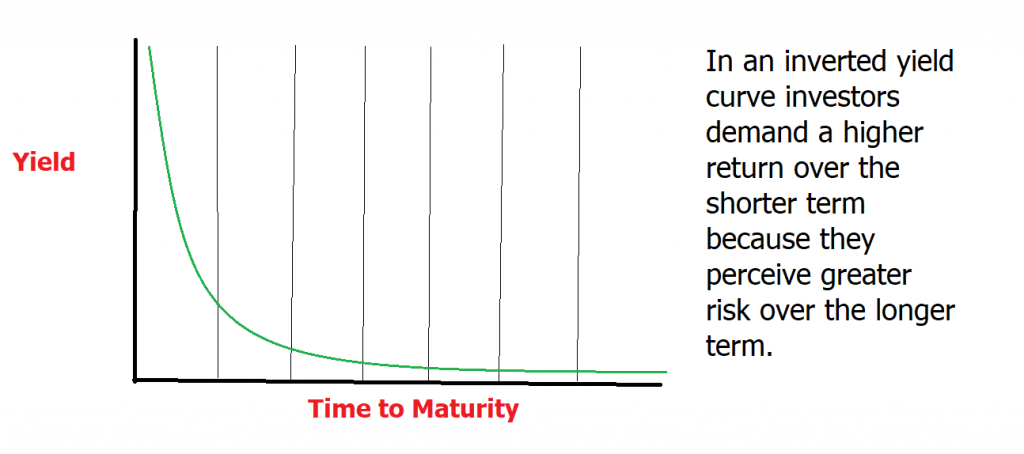
At the beginning of this year we wrote an article explaining the importance of understanding the yield curve and how it was getting very close to signaling the high probability of a recession in the coming year. Yesterday afternoon all of the major metrics on the yield curve had inverted. What this means is that investors who loan money to the government are demanding higher interest rates on shorter term bonds and notes than over the longer-term maturities. This barometer has been extremely accurate at forecasting recessions in the past essentially because it is communicating the people with money see greater risk on the longer-term horizon.
Over the last several years ETF’s have started offering inverse Treasury products which are a bet on rising interest rates. These ETF’s short the Bond market and increase in value as bond prices fall and interest rates go up.
On Wall Street one of the guidelines which money managers have utilized for decades to create a diversified portfolio is they invest 40% of a portfolio in bonds and 60% of the portfolio in stocks. This strategy worked well when interest rates were significantly higher, but it has been disastrous when interest rates were manipulated by the Fed to near zero percent levels. The 60/40 diversification principle worked because as stocks would tumble investors would make money on bond prices rising. However, since the beginning of this diversification principle has been responsible for exaggerated losses.
Since January 1, 2022, the S&P 500 is down -3.26%.
Bonds as measured by the 10 Year U.S. Treasury Note are down over -5.56%
Since many ETF’s utilize some leverage in their portfolios these drawdowns have been responsible for creating 20% losses in many conservative portfolios.
As I write this analysis here is a current snapshot of the interest rate environment.
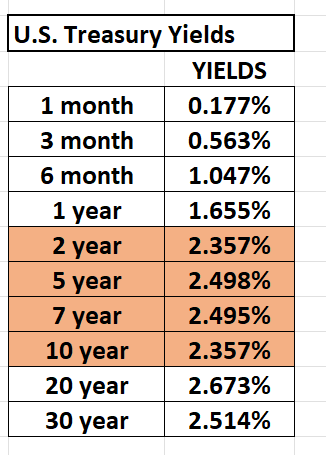
The Interest Rate market is flashing red. You can quickly see that the 5-year yield is higher than the 7 year and 10-year maturities. One important spread the comparison of the 2 years versus the 10 year and you can see that is currently at zero. These are ominous signals that have been very accurate in forecasting recessions over the past five decades. Equally of importance is that when shorter-term rates rise faster than longer-term rates, and the yield curve flattens, it’s often a sign of an economy that is slowing down.
On Wall Street traders like to joke that the Fed can raise interest rates as many times as they want until something breaks. Usually, a yield curve inversion event signifies that “something” has broken.
An inverted curve usually means poor returns for stocks and hits the profit margins of banks because they borrow cash at short-term rates, while lending at longer ones. Meanwhile, the shorter-term 2-year rate, which is tied to the near-term outlook for Fed policy, rose to its highest level since April 2019.
Let’s do some math here to understand the significance of this event.
If you lend the United States government $100,000 for 10 years at the current interest rate of 2.357% you will receive a coupon payment of $2,357 every year for 10 years and at the end of the term you will receive your $100,000 back. Now if interest rates remained stable and we did not have to factor in inflation we could look at this very analytically and determine that after 10 years we would receive back a total of $123,570. The challenge is that the future value of the dollar and its purchasing power is unknown. We do know that the last Consumer Price Index printed at 7.9% and we would need to subtract that value every year to determine what our real rate of return was.
However, if you have zero inflation over the next decade, then your $100,000 will be worth $100,000 in ten years’ time and all is rosy. But if we subtract the current rate of the CPI of 7.9% from your yield you are losing 5.55% every year. Multiply that by 10 years and you are looking at over a 45% loss on your initial $100,000 investment. Sad thing is, U.S. Treasuries have always been considered to be a solid conservative investment.
Traditionally Government pension funds are mandated to invest in these instruments. These state, local and federal pension program need 7% positive yields to remain feasible and guarantee the retirements of their pensioners. When they look at the yield curve, they are trying to make it hurt as little as possible. Meanwhile, the rest of the free market has determined that with the horrific Fed manipulation of interest rates that this entire sector and asset class is fraught with risk.
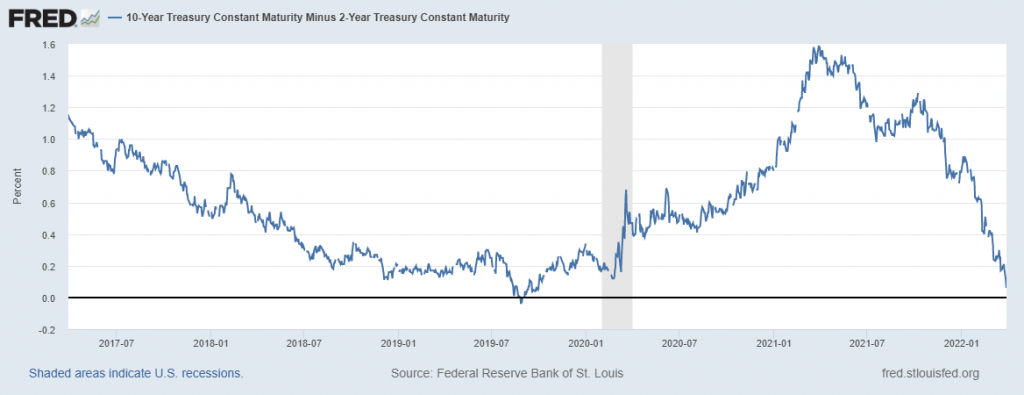
Today you could lend the government money for 2 years and get an equivalent yield than lending the government money for 10 years. The graph above provided by the St. Louis Federal Reserve shows a yield curve inversion precedes a recession by about 12 months (grey areas on the chart).
For investors and traders this is something that you need to be aware of. In this stagflationary environment, an idea worth considering is looking at investment opportunities and trades that increase in value with higher interest rates.
Regardless of how you evaluate the Interest Rate environment, the TREND is clearly UP which means bond prices are falling.
Today there are numerous ways in which a trader can capitalize on a declining bond market. In this analysis we will analyze and explore the opportunity of INVERSE ETF on the ProShares Ultrashort Treasury. The trading symbol is $TBT.
An inverse ETF is an exchange traded fund (ETF) created by using various derivatives to profit from a decline in the value of an underlying benchmark. Derivatives are instruments like options and futures contracts. Investing in inverse ETFs is like holding various short positions, which involve borrowing securities and selling them with the hope of repurchasing them at a lower price.
An inverse ETF is also known as a “Short ETF” or “Bear ETF.” Traders use inverse ETFs to inversely track an underlying index or group of investments you believe will drop in value. Or they use these instruments to hedge against downside risk in similar investments you own (in a long position).
Inverse ETFs allow investors to make money when the market or the underlying index declines, but without having to sell anything short. The value of the ETF is directly inverse to the value of the Index it is tracking.
The largest and most successful inverse ETFs aim to deliver the opposite returns of major indexes it tracks.
In this weekly stock study, we will look at and analyze the following indicators and metrics as are our guidelines to determine how to trade the $TBT ETF.
- 52-week high and low boundaries
- Best Case-Worst Case Analysis
- Vantagepoint A.I. Forecast (Predictive Blue Line)
- Neural Network Forecast
- Daily Range Forecast
- Intermarket Analysis
- Our trading suggestion
Readers may want to review an article we recently wrote which summarizes the current economic environments and the risks it poses for stocks. It is entitled: The Great Unraveling. What Happens When You Push on A String? That article lays out a fundamental trading thesis, but we always wait for the a.i. to correlate to that opinion before we take any action in the marketplace.
52-week High-Low Chart
We are huge believers in monitoring where a stock is trading in relation to its 52-week range. Our perspective is that winners continuously make new 52-week highs, and we want to be on board for those types of moves. We pay a great deal of attention to how an asset reacts and performs in relation to its 52-week high and low boundaries.
First let’s look at the very long-term trend. Here is a ten-year chart of $TBT. Since this is an inverse ETF, you can quickly see that since interest rates have dropped like a brick over the last decade the value of this ETF has been in a persistent downtrend
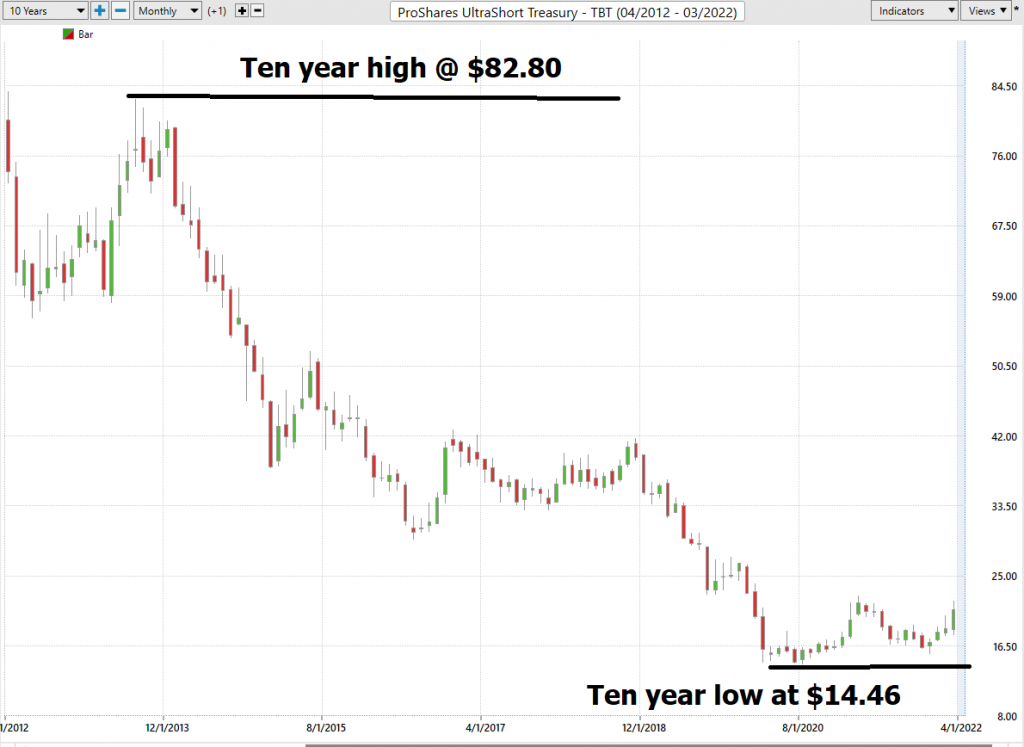
We find two points of great interest on this chart. First it bottomed during the start of the pandemic and second it has made a higher low recently. Equally of importance is that $TBT is at present time challenging its 52-week highs which is the benchmark that piques our interest the most.
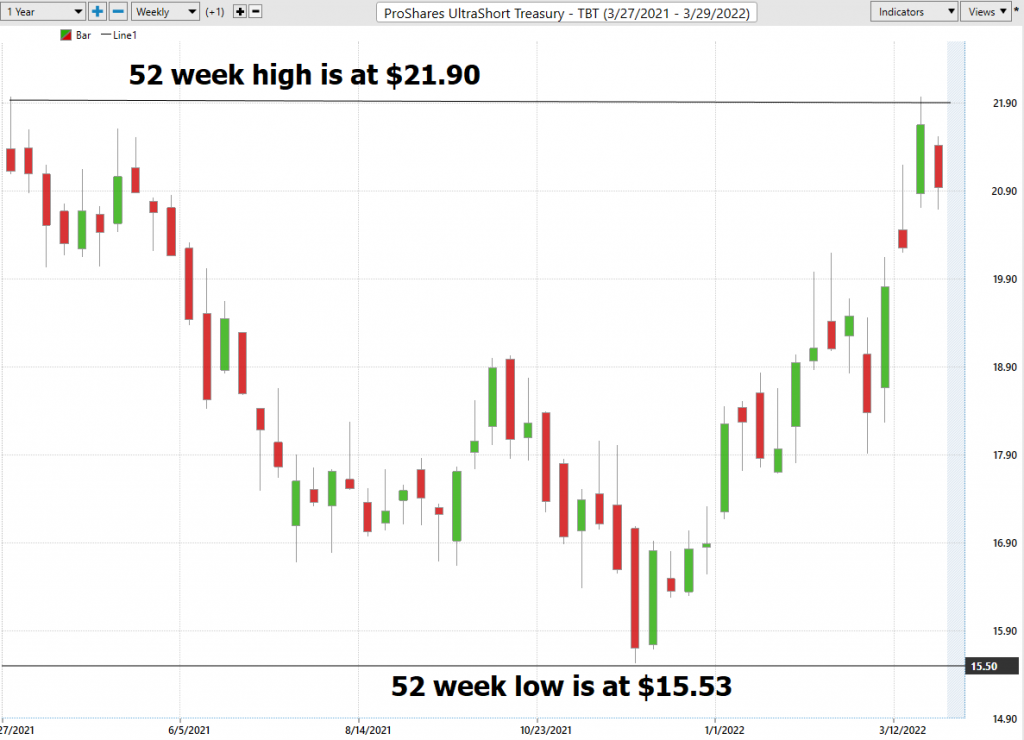
Over the last 52 weeks $TBT has traded as high as 21.90and as low as 15.53. We expect some consolidation at this 52-week boundary, but we think it will be breached in the coming weeks.
Based upon the high and low prices we can quickly see that the annual trading range of $TBT has been $6.37. This tells us that the average weekly trading range is .12.
What we often like to do as well is to divide the annual trading range (5.37) by the current price ($20.86) this gives us a very basic estimate of annualized volatility. Current annualized volatility is 25.74%. This metric essentially tells us that in one year, we can expect $TBT to be trading 25.7% higher or lower from current levels.
We refer to these as the commonsense metrics which we use as baseline measurements of understanding normal value. When using artificial intelligence, we look to amplify our returns based upon these baseline measurements.
What we like about this situation:
The Fed has promised to raise interest rates 7 more times in the next two years.
While we don’t trade on fundamentals, we have learned that when the a.i. creates an UP forecast it presents a great opportunity in this environment.
The market has resistance at its current 52 week high. Finding buying opportunities in this INVERSE ETF on pullbacks with good money management stops is something traders might want to consider.
Best Case – Worst Case Scenarios
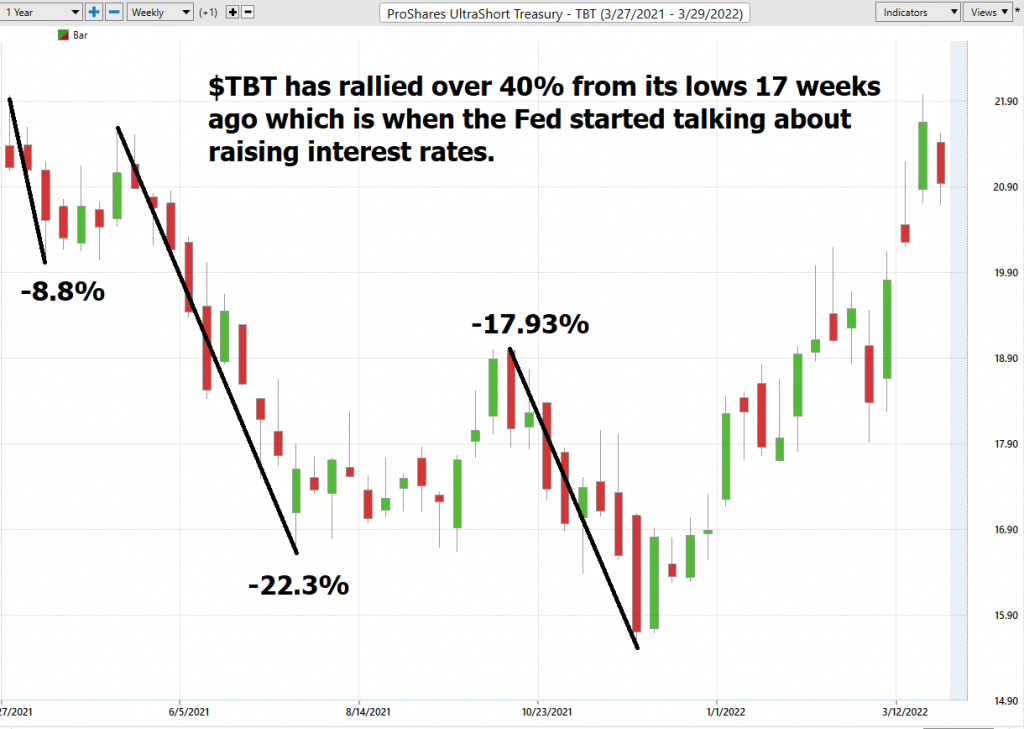
Next, we want to look at the trend over the past year and evaluate the strength of the rallies in relation to the declines. What makes $TBT attractive is that since the beginning of the year it is up 17.06% and has outperformed other asset classes and sectors by a wide margin.
When we look at the drawdowns in this sector over the past year, they have been large. You would expect this type of decline in a falling interest rate environment.
However, you can also see that $TBT has rallied over 40% in the last 17 weeks. This period is crucial to understand because it is exactly correlated to when the Fed started talking about raising interest rates.
As a trader, we think that buying pullbacks in the current environment with good money management will prove to be a good trade.
Over the past year:
$TBT over the last 52 weeks is DOWN -3.29%.
The DOW Jones is Up 6.48%
S&P 500 Index +16.59%
NASDAQ +22.71%
Russell 1000 Stock Index is up + 14.54%
The Vantagepoint A.I. Analysis
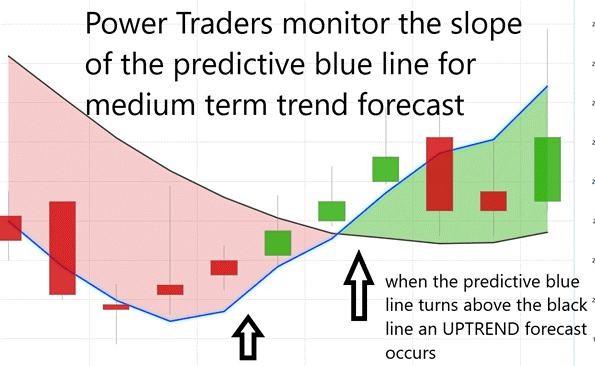
Using VantagePoint Software and the artificial intelligence, traders are alerted to trend forecasts by monitoring the slope of the predictive blue line. The black line is a simple 10 day moving average of price which simply tells you what has occurred in the market. The predictive blue line also acts as value zone where in uptrends traders try to purchase the asset at or below the blue line.
In studying the chart below pay close attention to the slope of the blue line. Anytime the blue line crosses the zero intercept is a trend signal. If the line crosses from down to up, an UP-trading opportunity exists. If the line crosses from Up to down the down trading opportunity exists.
The most recent UP forecast on 3/9/22 occurred at a price of $19.14.
Power traders use the predictive blue line in helping to determine both the value zone as well as the trend direction.
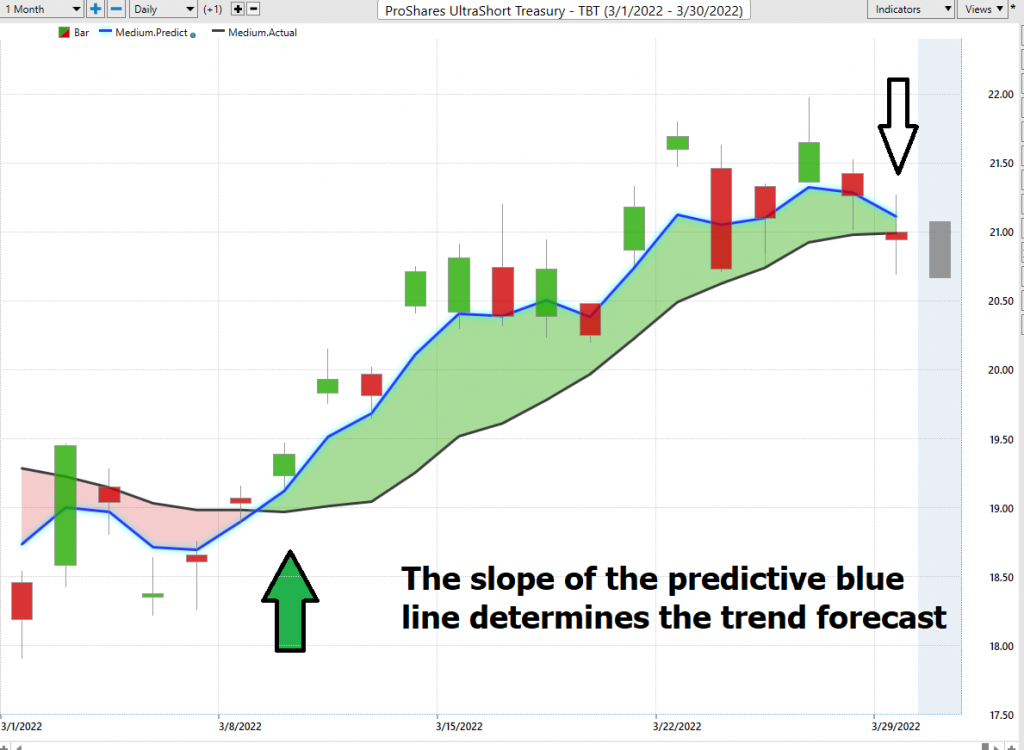
Observe how the SLOPE of the predictive blue line started moving higher a few days before its moving above the black line. A strong trend was evidenced by seeing that price was consistently closing above the predictive blue line. Price have rallied as high as $21.97 and are current trading in the $20.94 range. Power Traders who followed this forecast are up over 8% on this short-term trade.
Fine Tuning Entries with The Neural Net Indicator
At the bottom of the chart is the Neural Network Indicator which predicts future strength and/or weakness in the market with a 48-to-72-hour time horizon.
A Neural Net is a computational learning system that uses a network of functions to understand and translate massive amounts of data into a desired output, consistently monitoring itself and improving its performance.
When the Neural Net Indicator is green it communicates strength. When the Neural Net is Red it is forecasting short term weakness in the market.
We advocate that Power Traders cross reference the chart with the predictive blue line and neural network indicator to create optimal entry and exit points. This provides what we refer to as the DOUBLE CONFIRMATION setup.
Power Traders are always looking to apply both the neural network and a.i. to the markets to find statistically sound trading opportunities.
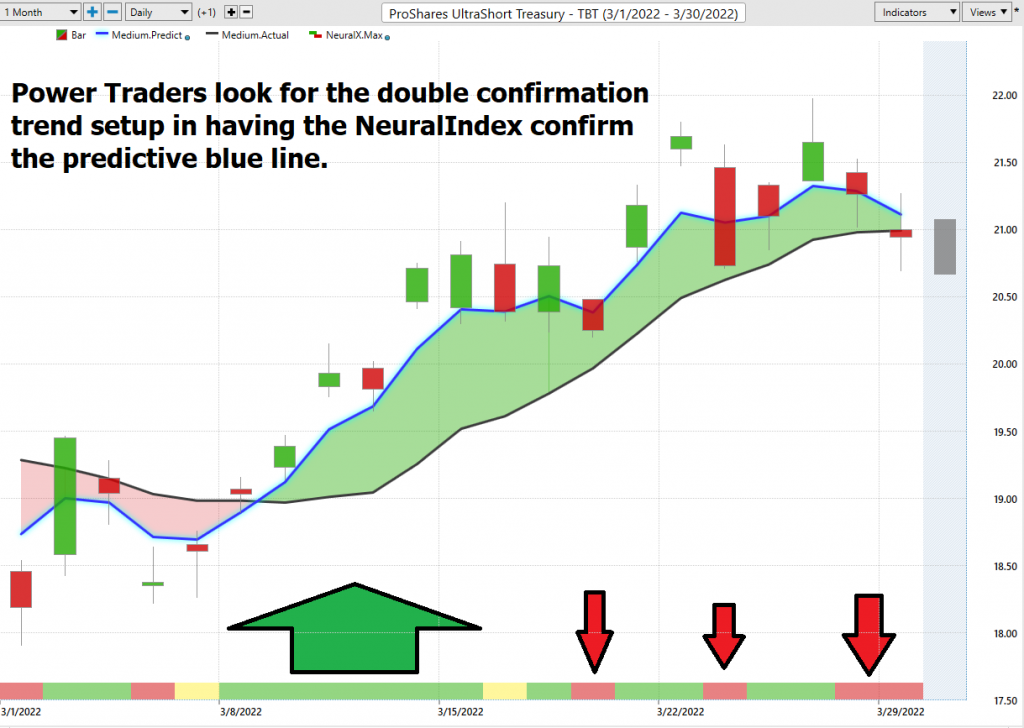
We advise Power Traders to cross reference the predictive blue line with the Neural Net for the best entry opportunities. Observe how by simply waiting for the green Neural Net to align with the predictive blue line the trading opportunity unfolded beautifully generating nice gains in just a few trading sessions.
VantagePoint Software Daily Price Range Prediction
The purpose of all these indicators so far is to help traders stay on the right side of the right trend at the right time.
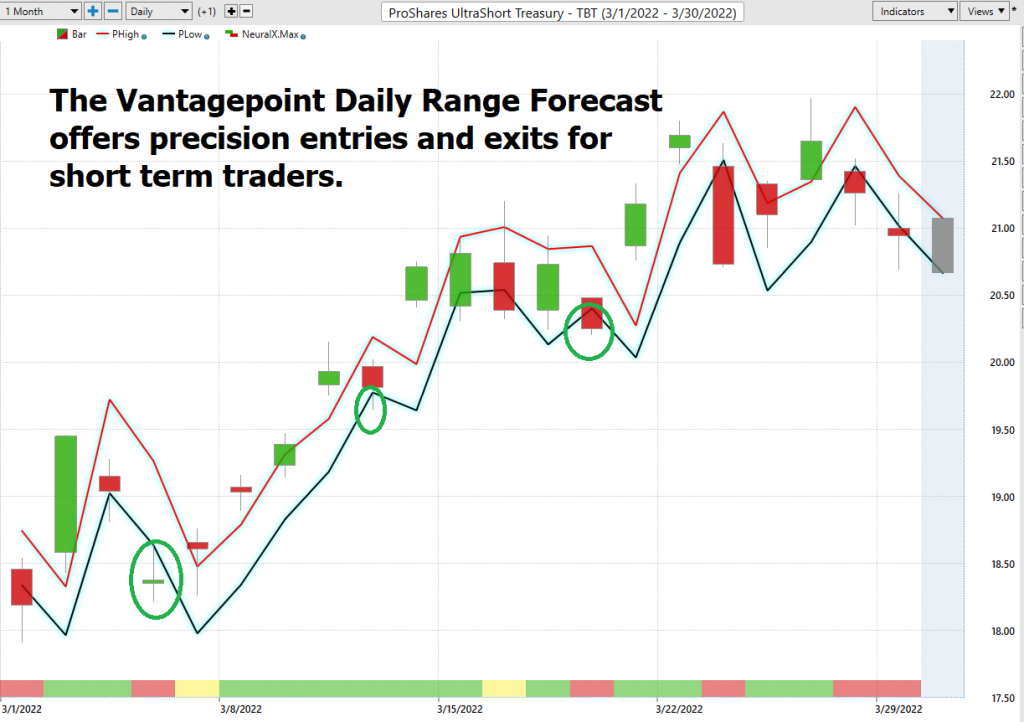
One of the powerful features in the Vantagepoint A.I. Software which Power Traders use daily is the Daily Price Range prediction forecast.
This forecast is what permits Power Traders to truly fine tune their entries and exits into the market often looking for smaller time frames and more granular trading opportunities.
Here is the price chart of $TBT during the most recent runup featuring the Daily Price Range forecast and the Neural Net Indicator.
All of the tools so far in this analysis attempt to define value and to clearly identify the trend and points within the trend where traders should look to capitalize on.
Intermarket Analysis
What makes the Vantagepoint Software totally unique is its ability to perform Intermarket analysis and to locate those assets which are most interconnected that are responsible for driving the price of $TBT higher or lower.
Studying the charts can always provide objective realities in terms of locating support and resistance levels which become clear on a chart. But we live in a global marketplace. Everything is interconnected. The billion-dollar question for traders is always what are the key drivers of price for the underlying asset that I am trading?
These intangibles are invisible to the naked eye yet show extremely high statistical correlations.
Slight changes in Interest rates, Crude Oil Prices, and the Volatility of the dollar amongst thousands of other variables affect the decisions companies must make to survive in these very challenging times. Trying to determine what these factors are is one of the huge problems facing investors and traders.
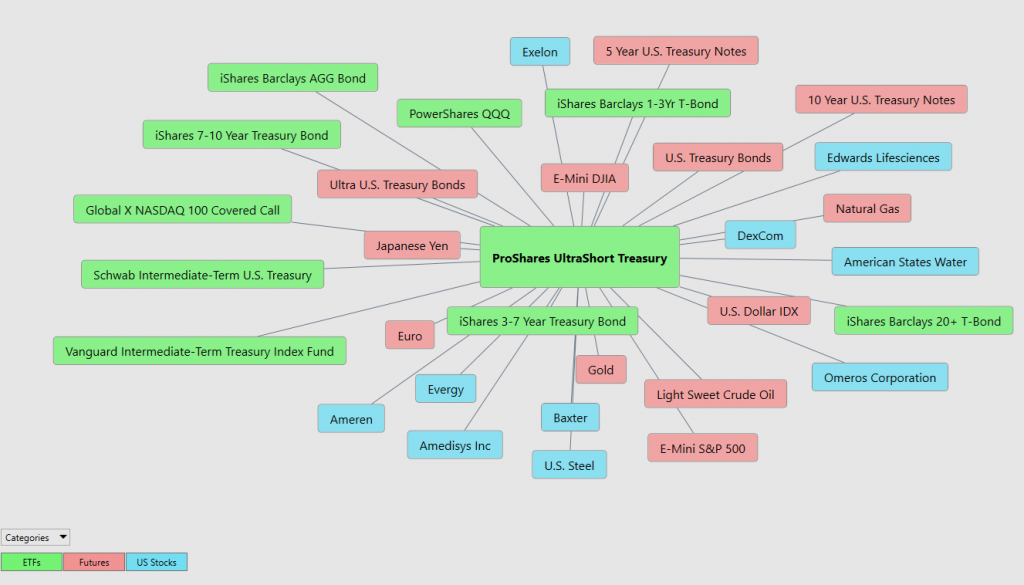
There is great value to be had in studying and understanding the key drivers of $TBT price action. This graphic presents a plethora of opportunities that can quickly be explored within the software.
This is an amazing research tool that consistently uncovers future gems.
Our Suggestion
In our estimation, what is driving the stock markets is a chase for yield, all fueled by Fed Stimulus and low interest rates. This craze has been in play since the Great Financial Crisis of 2008. The Fed is trying to remove the punchbowl from the party without crashing the markets or the economy.
We think the Fed is between a rock and a hard place and as much as they want to raise rates, they recognize that the risk is sky high.
The most important yield curve metric for long-term investors has historically been the spread between the 2-year Treasuries and the 10-year Treasuries. This yield curve has been the most predictive.
When the spread between 2 and 10 is healthy and slopes higher, our economy is growing.
When the spread between 2 and 10 flattens, it signals a slowdown.
When it inverts, it always spells trouble and means with high probability that a recession is on the horizon.
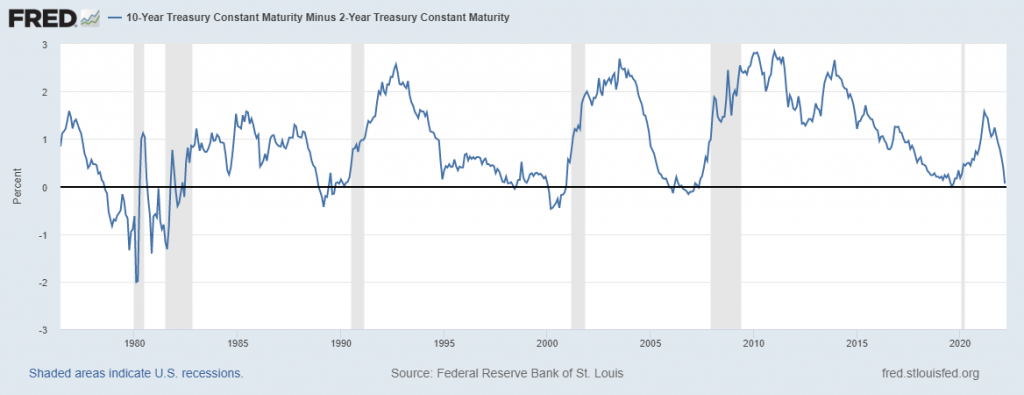
The chart highlights that every time the spread between the 2’s and 10’s has inverted since the 1970s, it’s been a warning sign that a recession was imminent. The gray bars in the chart below represent recessions.
The problem this time around is that I am not aware of any time in economic history where a recession started with interest rates already this low. Expect to see some interesting narratives coming from the FED. Since the BOND market domestically is valued at about $100 trillion this is a big deal. Bond investors will be looking for a safe haven if inflation continues to rage.
For this reason, we think that $TBT is worthy of your consideration.
The one factor that separates great traders from amateurs is money management.
An amateur trader will risk their entire portfolio on one trade and lives for the adrenalin rush that the risk creates.
Our trades are based upon the a.i. analysis.
We think that the volatility will be increasing in stocks throughout 2022. As it does $TBT should do quite well. We think it is prudent to look for buying opportunities in any breaks in the price action.
Let’s Be Careful Out There!
Remember, It’s Not Magic.
It’s Machine Learning.

IMPORTANT NOTICE!
THERE IS SUBSTANTIAL RISK OF LOSS ASSOCIATED WITH TRADING. ONLY RISK CAPITAL SHOULD BE USED TO TRADE. TRADING STOCKS, FUTURES, OPTIONS, FOREX, AND ETFs IS NOT SUITABLE FOR EVERYONE.
DISCLAIMER: STOCKS, FUTURES, OPTIONS, ETFs AND CURRENCY TRADING ALL HAVE LARGE POTENTIAL REWARDS, BUT THEY ALSO HAVE LARGE POTENTIAL RISK. YOU MUST BE AWARE OF THE RISKS AND BE WILLING TO ACCEPT THEM IN ORDER TO INVEST IN THESE MARKETS. DON’T TRADE WITH MONEY YOU CAN’T AFFORD TO LOSE. THIS ARTICLE AND WEBSITE IS NEITHER A SOLICITATION NOR AN OFFER TO BUY/SELL FUTURES, OPTIONS, STOCKS, OR CURRENCIES. NO REPRESENTATION IS BEING MADE THAT ANY ACCOUNT WILL OR IS LIKELY TO ACHIEVE PROFITS OR LOSSES SIMILAR TO THOSE DISCUSSED ON THIS ARTICLE OR WEBSITE. THE PAST PERFORMANCE OF ANY TRADING SYSTEM OR METHODOLOGY IS NOT NECESSARILY INDICATIVE OF FUTURE RESULTS. CFTC RULE 4.41 – HYPOTHETICAL OR SIMULATED PERFORMANCE RESULTS HAVE CERTAIN LIMITATIONS. UNLIKE AN ACTUAL PERFORMANCE RECORD, SIMULATED RESULTS DO NOT REPRESENT ACTUAL TRADING. ALSO, SINCE THE TRADES HAVE NOT BEEN EXECUTED, THE RESULTS MAY HAVE UNDER-OR-OVER COMPENSATED FOR THE IMPACT, IF ANY, OF CERTAIN MARKET FACTORS, SUCH AS LACK OF LIQUIDITY. SIMULATED TRADING PROGRAMS IN GENERAL ARE ALSO SUBJECT TO THE FACT THAT THEY ARE DESIGNED WITH THE BENEFIT OF HINDSIGHT. NO REPRESENTATION IS BEING MADE THAT ANY ACCOUNT WILL OR IS LIKELY TO ACHIEVE PROFIT OR LOSSES SIMILAR TO THOSE SHOWN.

