
![]()
Repligen Corporation is a leading provider of advanced bioprocessing technologies and solutions used by large biopharmaceutical companies and contract manufacturing organizations for manufacturing biologic drugs, such as monoclonal antibodies (mAbs) and gene therapies. The company is based in Waltham, Massachusetts.
RGEN being a biotech company has benefited greatly from the pandemic because of the hope its monoclonal antibodies solution offers to anyone who has contracted COVID-19.
For 2020, the company’s total revenues of $366.3 million were up 35.6% year over year. Overall, organic revenue growth was 29% last year. The company has been growing revenue very dramatically forcing Wall Street Analysts to upgrade their forecasts and projections.
With the onset of the pandemic companies that make the tools and equipment for drug development are very much in demand. RGEN produces filtration equipment, fluid management and other bio-processing tools to also assist other drug companies in the manufacture of biologic drugs. Demand for these biologic drugs has increased exponentially in the last 18 months. Nearly 28% of Repligen’s projected annual revenue is expected to come from its COVID-19 programs.
In this weekly stock study, we will look at and analyze the following indicators and metrics as are our guidelines which dictate our behavior in deciding whether to buy, sell, or stand aside on a particular stock.
- Wall Street Analysts’ Estimates
- 52-week high and low boundaries
- Vantagepoint A.I. Forecast (Predictive Blue Line)
- Neural Network Forecast
- Daily Range Forecast
- Intermarket Analysis
- Our trading suggestion
We don’t base our trading decisions on things like earnings or fundamental cash flow valuations. However, we do look at them to better understand the financial landscape that a company is operating under.
Analysts Ratings
Based on 6 Wall Street analysts offering 12-month price targets for Repligen in the last 3 months. The average price target is $279.60 with a high forecast of $335.00 and a low forecast of $240.00. The average price target represents a negative 11.01% change from the last price of $314.18.
Power Traders love to see this type of divergent opinion on a stock that is widely traded. RGEN has had huge momentum. It’s become a favorite stock of swing traders particularly after earnings announcements.
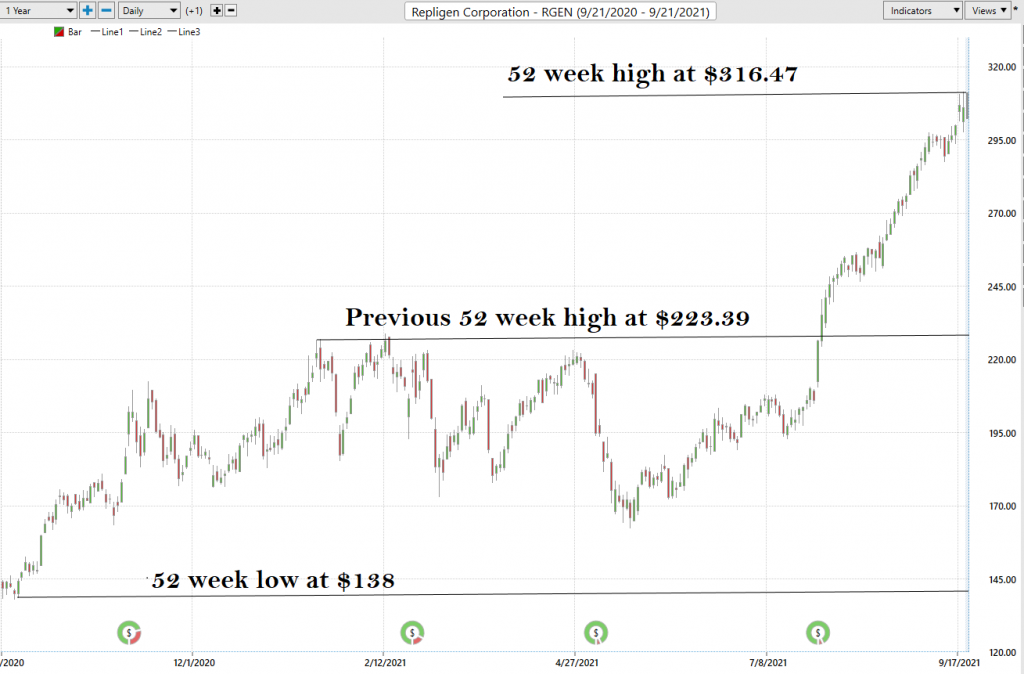
52-week High-Low Chart
Over the last 52 weeks RGEN has traded as high as 316.47 and as low as 138. This means provides us with an annual trading range of $178.47 When we divide this metric by 52 weeks, we can determine that the average weekly trading range for RGEN is $3.43. What we often like to do as well is to divide the annual trading range (178.47) by the current price ($314) to provide us with a very basic and generic calculation of how the annualized volatility for RGEN, which is currently 56%.
We refer to these as the commonsense metrics which we use as baseline measurements of understanding normal value. When using artificial intelligence, we look to amplify our returns based upon these baseline measurements.
Whenever we trade, we always pay attention to where we are in relation to the 52-week trading range. It is very common to see the 52-week high provide very strong resistance to the market until it is breached. Often when the 52-week high is breached we will see the stock price explode higher very quickly over a very short period.
What is obvious about studying the RGEN chart is that EARNINGS are the major catalyst driving stock price. If you look at the EARNINGS ICON at the bottom of the chart you can see how the stock moves violently before and after the earnings are announced.
Power Traders focus only upon the a.i. forecast in these time frames to exploit a strong short-term trend.
It is worth being aware of what happened on the quarterly earnings announcements over the last year.
11/5/20 earnings announcement saw earnings increase 42% higher than expected. Stock rallied 12% in 7 days.
2/24/21 earnings announcement saw earnings 67% better than expected. Stock dropped 20% in 7 days.
5/4/21 earnings announcement was 58% better than expected. Stock drops 24% in 10 days.
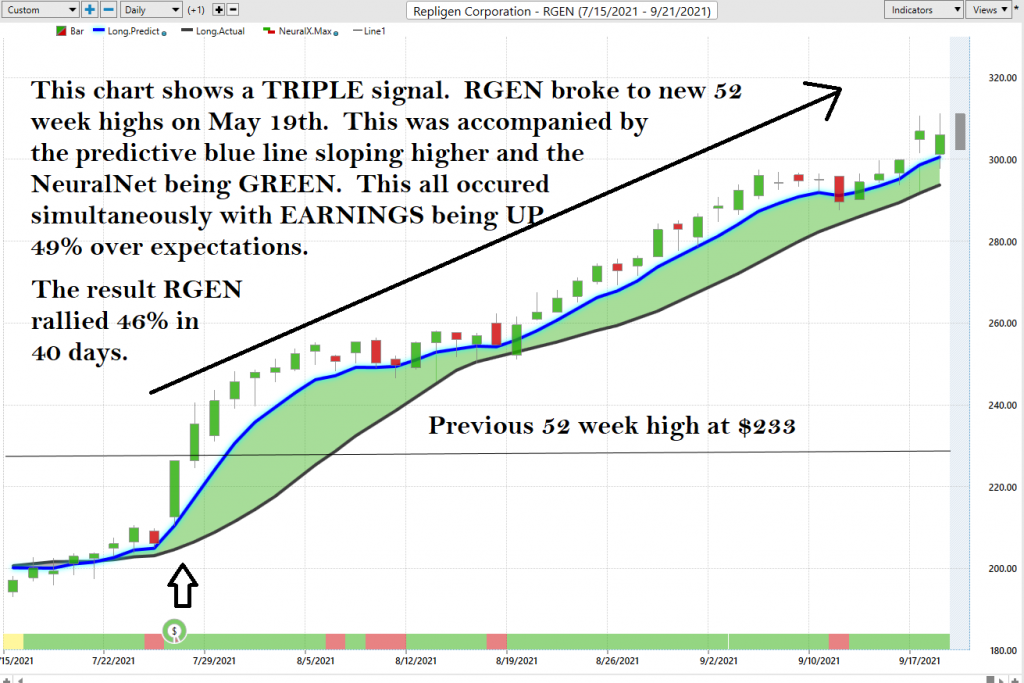
7/27/21 earnings announcement was 49% better than expected and stock rallies 47% in the next 41 days.
Awareness of this volatility is very valuable to a trader as the trends are sharp and sudden.
The a.i. can be invaluable in these instances. Power traders focus on the earnings announcement and will trade in the general direction of the a.i. trend forecast when the earnings announcements occur.
Best Case – Worst Case Scenarios
When we study the long term 52-week chart we can look at the best case and worst-case scenarios just to get an eyeball perspective of the risk and volatility of this asset. This is worth doing anytime you invest or trade to monetarily understand what the potential risks and rewards have been over the past year.
The worst-case scenario for bulls would have been to blindly purchase RGEN at $220 on 5/4/2021 before the earnings announcement. In this worst-case scenario, the market slid 24% in the next 10 trading sessions before finding a bottom.
The best-case scenario on RGENN would have occurred if an investor/trader was lucky enough to buy RGEN at its yearly lows on 9/23/20 at $131 per share. In this best-case scenario, RGEN has rallied 118% over the last year.
It is worth doing this type of baseline analysis because it allows you to quickly compare the performance of RGEN to the major broad market indexes. Over the past year RGEN has been a major leader.
RGEN + 118%
S&P 500 Index +31%
Down Jones Industrials +24%
NASDAQ +34.5%
So, in RGEN we have an asset which historically has massively outperformed the broader stock market indexes. In the past year the worst-case downside was -26%% and the best-case upside was +118%.
The volatility of RGEN is significantly higher than the broader market indexes. Anytime it drops 18% from a recent high you should put it on your radar and wait for the a.i. forecast to turn positive.
The Vantagepoint A.I. Analysis
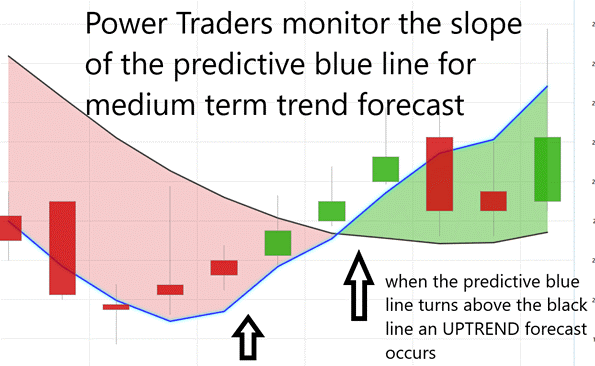
Using VantagePoint Software and the artificial intelligence, traders are alerted to trend forecasts by monitoring the slope of the predictive blue line. The black line is a simple 10 day moving average of price which simply tells you what has occurred in the market. The predictive blue line also acts as value zone where in uptrends traders try to purchase the asset at or below the blue line.
Let’s first look at the long-term annual chart and then we can zoom in on a smaller time frame.
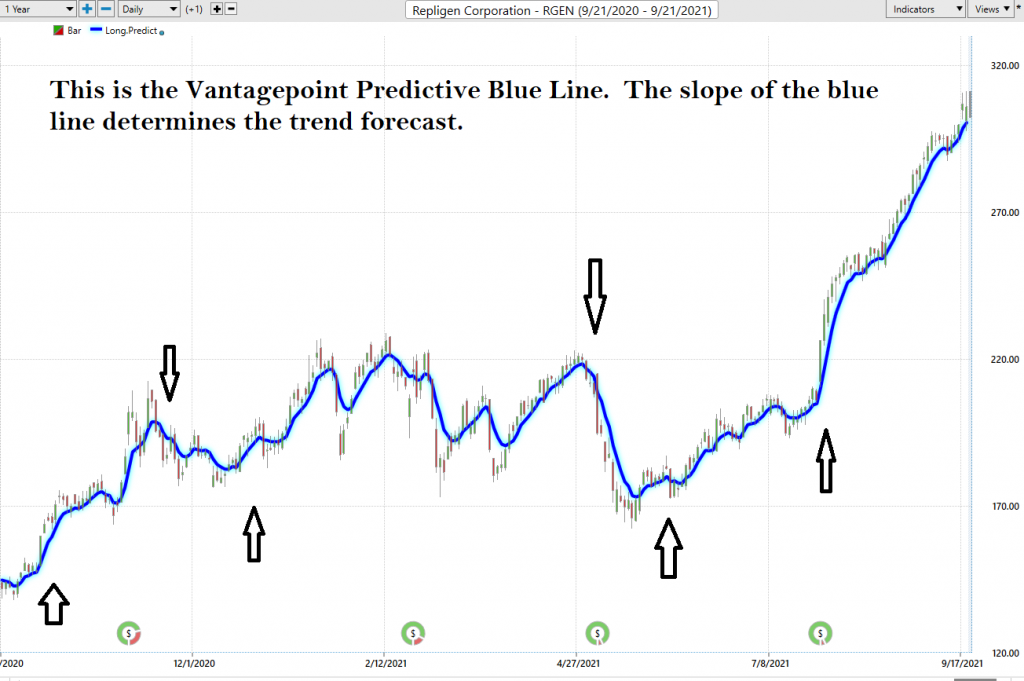
In studying the chart above pay close attention to the slope of the blue line.
Power Traders pay close attention to the relationship between the black line and predictive blue line. The black line is just a simple 10 day moving average. It Is calculated by taking the closing prices of the last 10 days and dividing that sum by 10. All that the black line tells you is what has occurred. It tells you where prices have been and what the average price over the last ten days is.
The predictive blue line, on the other hand utilizes that Vantagepoint patented Neural Network and Intermarket Analysis to arrive at its value. It looks at the strongest price drivers of an asset through artificial intelligence and statistical correlations to determine its value.
We will analyze the time frame from July 13, 2021 to September 22, 2021 for RGEN stock so that you can appreciate the power of the artificial intelligence in a real time trading situation.
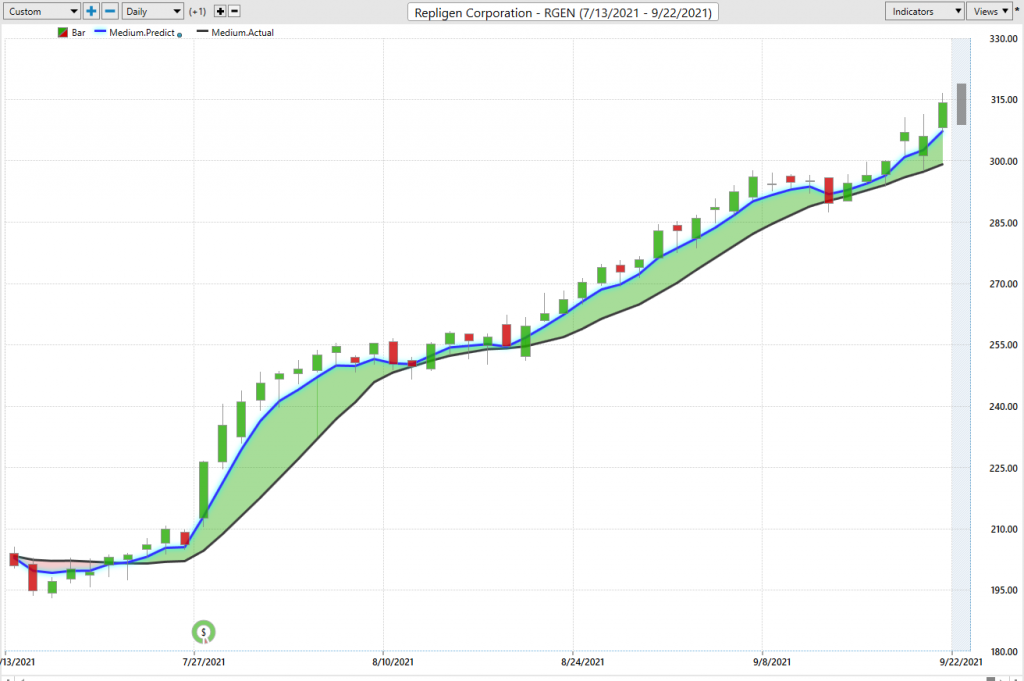
Whenever we see the predictive blue line move above the black line, we are presented with an UP-forecast entry opportunity. This is what occurred on July 21, 2021 @ $203.60 per share.
Power traders use the predictive blue line in helping to determine both the value zone as well as the trend direction.
Observe how the SLOPE of the predictive blue line started moving higher a few days previous to its moving above the black line. A very strong trend was evidenced by seeing that price was consistently closing above the predictive blue line.
Fine Tuning Entries with The Neural Net Indicator
At the bottom of the chart is the Neural Network Indicator which predicts future strength and/or weakness in the market. When the Neural Net Indicator is green it communicates strength. When the Neural Net is Red it is forecasting short term weakness in the market.
We advocate that Power Traders cross reference the chart with the predictive blue line and neural network indicator to create optimal entry and exit points.
Power Traders are always looking to apply both the neural network and a.i. to the markets to find statistically sound trading opportunities.
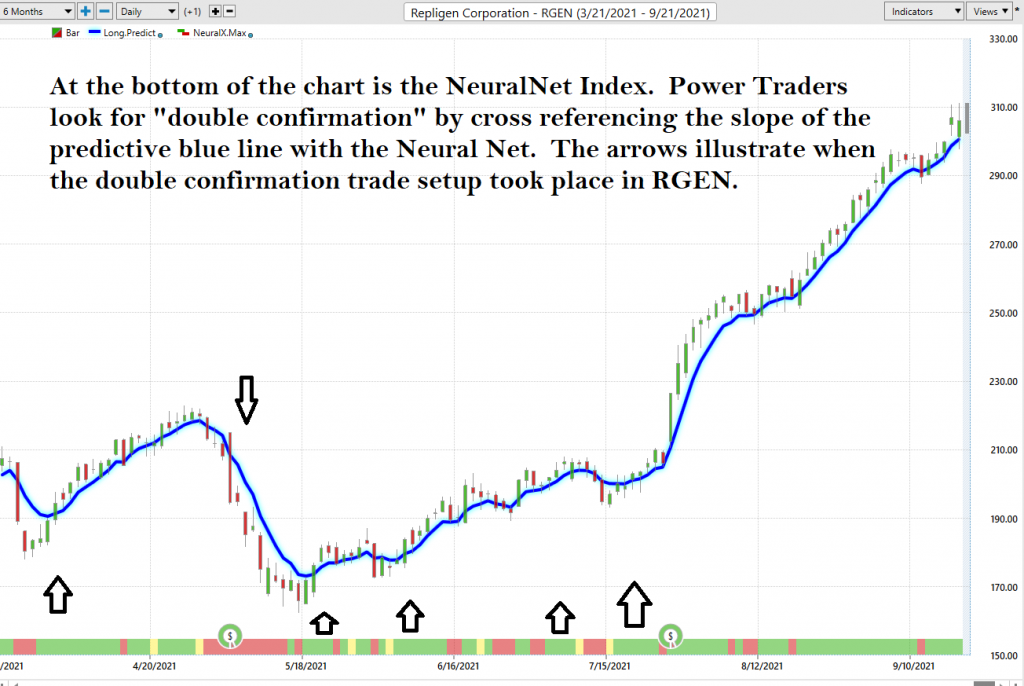
We advise Power Traders to cross reference the predictive blue line with the Neural Net for the best entry opportunities. Observe how the slope of the predictive blue line has remained positive from the time earnings were announced.
VantagePoint Software Daily Price Range Prediction
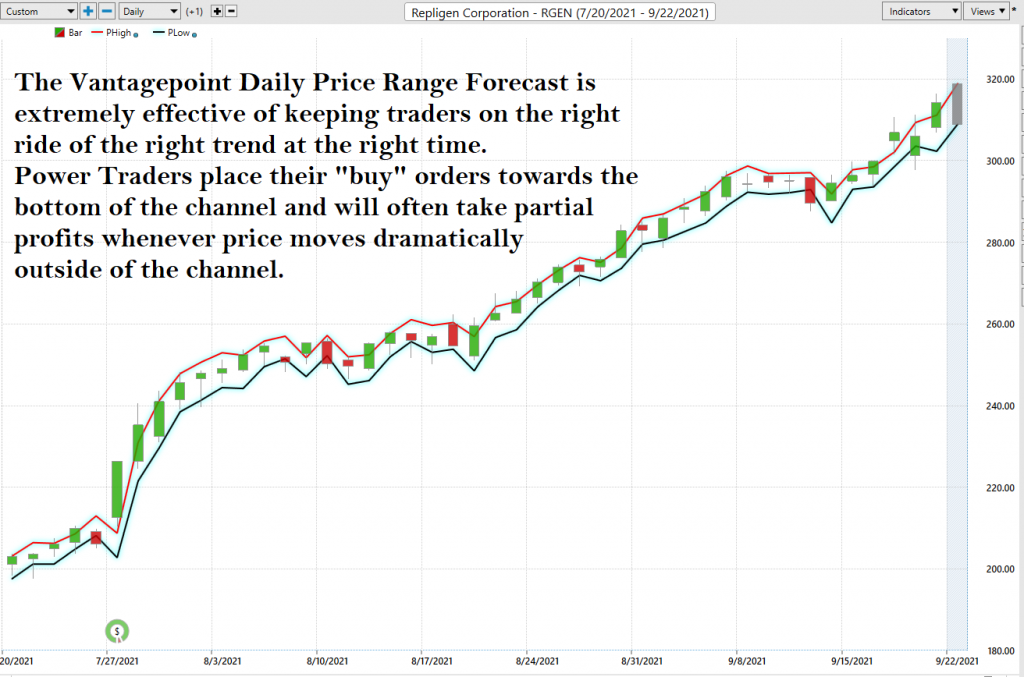
One of the powerful features in the Vantagepoint A.I. Software which Power Traders use daily is the Daily Price Range prediction forecast.
This forecast is what permits Power Traders to truly fine tune their entries and exits into the market.
Here is the price chart of RGEN during the most recent runup featuring the Daily Price Range forecast and the Neural Net Indicator.
In summary, the trend turned up. Prices have surged since that forecast and the trend remained firmly UP. Traders have had numerous opportunities to purchase RGEN towards the lower end of the daily price forecast to fine tune their entries.
Intermarket Analysis
What makes the Vantagepoint Software truly unique is its ability to perform Intermarket analysis and to locate those assets which are most interconnected that are responsible for driving the price of RGEN higher or lower.
Studying the charts can always provide objective realities in terms of locating support and resistance levels which become very clear on a chart. But we live in a global marketplace. Everything is interconnected. The billion-dollar question for traders is always what are the key drivers of price for the underlying asset that I am trading?
These intangibles are invisible to the naked eye yet show very high statistical correlations.
Small changes in Interest rates, Crude Oil Prices, and the Volatility of the dollar amongst thousands of other variables affect the decisions companies must make to survive in these very challenging times. Trying to determine what these factors are is one of the huge problems facing investors and traders.
There is great value to be had in studying and understanding the key drivers of RGEN price action.
By doing so you can often see which ETFs are most likely acquiring RGEN as well as uncovering other industries which affect RGEN price movement.
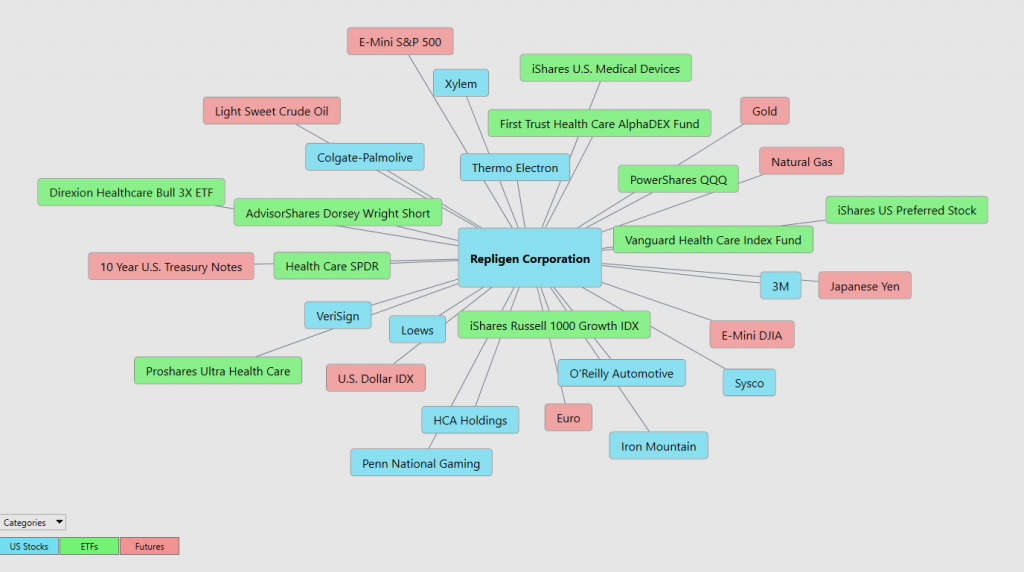
Keep in mind that since RGEN is up 118% over the past year these drivers are both positively and negatively correlated. This is an amazing research tool that consistently uncovers future gems.
Our Suggestion
The consensus of analysts’ opinions shows that RGEN is overvalued at $314.
The next earnings call is scheduled for November 3rd. Momentum is very strong on this asset. Since the company continues to outperform on its earnings estimates we think this tailwind will propel prices higher, but it will not be a straight shot. Earnings are forecasted to grow by 20% next year. Over the past year due to the pandemic earnings grew by over 223%. With COVID-19 remaining a very normal part of life we think that RGEN has the capacity to continue to beat earnings.
This stock is very pricey. Whenever you trade a highflyer like RGEN we recommend extreme money management. You have to brace yourself for massive volatility. This could be a perfect stock for experienced swing traders.
We will look to buy sudden breaks in the market if the a.i. forecast remains UP we will scale in small positions with tight stop losses.
Let’s Be Careful Out There!
Remember, It’s Not Magic.
It’s Machine Learning.

IMPORTANT NOTICE!
THERE IS SUBSTANTIAL RISK OF LOSS ASSOCIATED WITH TRADING. ONLY RISK CAPITAL SHOULD BE USED TO TRADE. TRADING STOCKS, FUTURES, OPTIONS, FOREX, AND ETFs IS NOT SUITABLE FOR EVERYONE.
DISCLAIMER: STOCKS, FUTURES, OPTIONS, ETFs AND CURRENCY TRADING ALL HAVE LARGE POTENTIAL REWARDS, BUT THEY ALSO HAVE LARGE POTENTIAL RISK. YOU MUST BE AWARE OF THE RISKS AND BE WILLING TO ACCEPT THEM IN ORDER TO INVEST IN THESE MARKETS. DON’T TRADE WITH MONEY YOU CAN’T AFFORD TO LOSE. THIS ARTICLE AND WEBSITE IS NEITHER A SOLICITATION NOR AN OFFER TO BUY/SELL FUTURES, OPTIONS, STOCKS, OR CURRENCIES. NO REPRESENTATION IS BEING MADE THAT ANY ACCOUNT WILL OR IS LIKELY TO ACHIEVE PROFITS OR LOSSES SIMILAR TO THOSE DISCUSSED ON THIS ARTICLE OR WEBSITE. THE PAST PERFORMANCE OF ANY TRADING SYSTEM OR METHODOLOGY IS NOT NECESSARILY INDICATIVE OF FUTURE RESULTS. CFTC RULE 4.41 – HYPOTHETICAL OR SIMULATED PERFORMANCE RESULTS HAVE CERTAIN LIMITATIONS. UNLIKE AN ACTUAL PERFORMANCE RECORD, SIMULATED RESULTS DO NOT REPRESENT ACTUAL TRADING. ALSO, SINCE THE TRADES HAVE NOT BEEN EXECUTED, THE RESULTS MAY HAVE UNDER-OR-OVER COMPENSATED FOR THE IMPACT, IF ANY, OF CERTAIN MARKET FACTORS, SUCH AS LACK OF LIQUIDITY. SIMULATED TRADING PROGRAMS IN GENERAL ARE ALSO SUBJECT TO THE FACT THAT THEY ARE DESIGNED WITH THE BENEFIT OF HINDSIGHT. NO REPRESENTATION IS BEING MADE THAT ANY ACCOUNT WILL OR IS LIKELY TO ACHIEVE PROFIT OR LOSSES SIMILAR TO THOSE SHOWN.

