
![]()
One of the huge challenges on Wall Street is learning to separate fact from fiction from narrative. This is particularly true for a company like Silicon Motion Technology Corp. ($SIMO) which engages in the development, manufacture, and supply of semiconductor products for the electronics market. It offers embedded and expandable storage, radio frequency integrated circuits, and embedded graphics.
The challenge of number crunchers who study balance sheets is that $SIMO has been consistently growing earnings over the last eight quarters which is very impressive. However, are these increases due to increased efficiency and better productivity? Or are they the result of inflationary pressures which have benefited $SIMO with significantly higher pricing possibilities?
A quick analogy is in order. Let’s say that you sell apples. You have 1,000 apples in inventory, and they are priced at $1.00 each. Now inflation rears its ugly head and INITIALLY you benefit by selling your apples for $1.10. Your margins look like they increased 10%. At first this seems like additional profits to the balance sheet until the inflationary pressures are factored in showing your additional costs of acquiring apples.
While this is a highly simplified accounting example, it is what occurs initially during an onset of inflation. Since $SIMO produces electronic chip components which have suffered from massive supply-side shocks, Wall Street is trying to discern real value on $SIMO’s balance sheet. $SIMO is engaged in the development of NAND flash controller integrated circuits (ICs) for solid-state storage devices, as well as specialty radio frequency (RF) ICs for mobile devices.
The fundamental outlook for semiconductors is strong post lockdown. The industry is poised to grow handsomely as the online world continues an aggressive adoption of the Internet of Things technology. The semi-conductor industry is dealing with chip constraints that are more sever than any time in the last 30 years.
Analysts estimate earnings increase this quarter of $0.35 per share, an increase next quarter of $0.61 per share, an increase this year of $1.76 per share, and an increase next year of $1.05 per share.
Currently, there are active takeover rumors running the narrative on $SIMO which has been responsible for inflating the price of a stock. That dynamic was in play on Monday, with $SIMO up 13% on the rumors. The company has a market cap of $3 billion and trades on average 599,000 shares per day.
Its next earnings call is expected on May 4, 2022.
In this weekly stock study, we will look at and analyze the following indicators and metrics as are our guidelines which dictate our behavior on a particular stock.
- Wall Street Analysts’ Estimates
- 52-week high and low boundaries
- Best Case – Worst Case Analysis
- Vantagepoint A.I. Forecast (Predictive Blue Line)
- Neural Network Forecast
- Daily Range Forecast
- Intermarket Analysis
- Our trading suggestion
We don’t base our decisions on things like earnings or fundamental cash flow valuations. However, we do look at them to better understand the financial landscape that a company is operating under.
Analysts Ratings
The first set of boundaries which we explore in our stock study is what do the professionals think who monitor the stock for a living. We can acquire this information by simply looking at the boundaries that the top Wall Street Analysts set for $SIMO. This initial set of boundaries provides us with an idea of what is expensive, fairly valued, and cheap.
Based on 4 Wall Street analysts offering 12-month price targets for Silicon Motion in the last 3 months. The average price target is $113.50 with a high forecast of $130.00 and a low forecast of $106.00. The average price target represents a 35.28% change from the last price of $83.90.
From this simple analysis we can see that $SIMO is trading below what top analysts on Wall Street feel is fair value.
52-Week High-Low Chart
Where the rubber meets the road as far as analysis is concerned is looking at the charts and evaluating where the asset stands in relation to its 52-week highs. As counterintuitive as it may sound, great stocks tend to consistently make new 52-week highs.
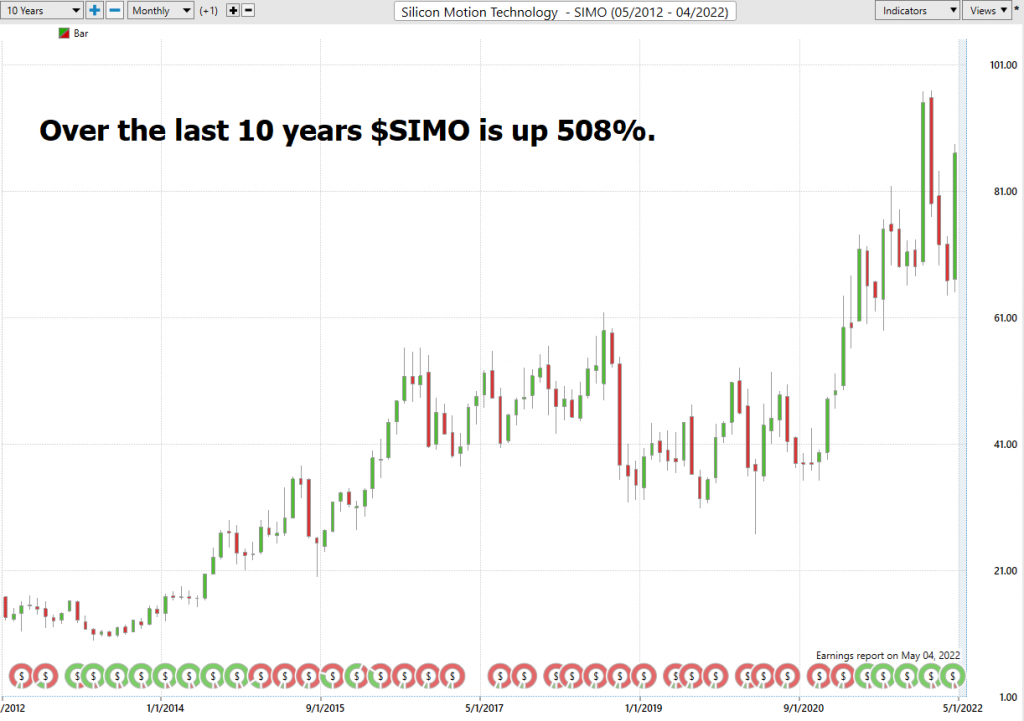
One of the simplest ways to evaluate a stock is to look at some long term monthly and weekly charts to be able to zoom out and see the big picture of the trend. Some of the greatest traders in the world use the longer-term monthly charts to determine trend analysis.
Here is the 52-week chart of $SIMO.
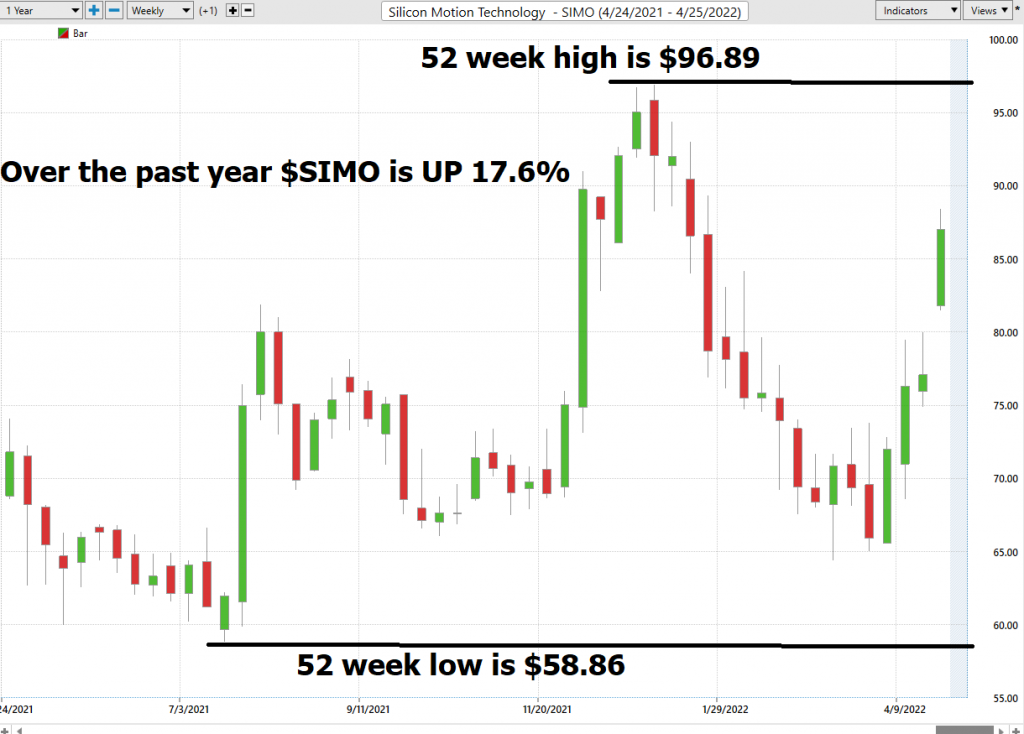
Whenever we trade, we always pay attention to where we are in relation to the 52-week trading range. It is quite common to see the 52-week high provide strong resistance to the market until it is breached. Often when the 52-week high is breached we will see the stock price explode higher very quickly over a short period.
$SIMO has traded as high as $96.89 and as low as $58.86 over the last 52 weeks. Its annual trading range has been $38.03 which means that its average weekly trading range has been $.73. It is currently trading at its 66th percentile based upon its annual range.
We also like to take the annual trading range of $38.03 and divide it by the current price of $83.90 to calculate a broad-based measure of volatility. This tells us that the current volatility is 45.3%. This metric allows us to define what are generally normal boundaries for the next year based upon this level of volatility.
If this same level of volatility continues moving forward we can broadly estimate that the range over the next year would be as high as $121.93 and as low as $45.97. We are not saying these boundaries will be reached. Instead, we are simply taking the current level of volatility and adding and subtracting it from the current price to establish these boundaries.
What we find intriguing is that the high forecast from top Wall Street Analysts is even higher than our upper boundary based upon annualized volatility.
We should expect extremely broad swings in $SIMO moving forward. The stock looks like it is poised to challenge both its 52-week high as well as its 10-year high.
The 52-week boundary often acts as significant resistance in thwarting trends.
You can observe that as $SIMO was making new 52-week highs every week until it had the massive blow off top exhaustion candle. Prices have now sold off and consolidated. We must pay attention to the highest weekly and monthly closes on the chart and observe how price reacts to those ranges.
Best Case – Worst Case Analysis
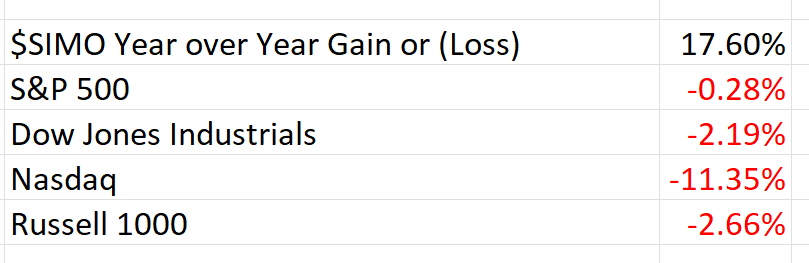
Next, we want to evaluate $SIMO is in comparison to the performance of the major stock market indexes which we have greater familiarity with and then look at the drawdowns of the stock over the past year to get a worst-case scenario idea for any conclusions that we might reach when we trade this asset.
- $SIMO Year over Year Gain 17.60%
- S&P 500 down -0.28%
- Dow Jones Industrials down -2.19%
- Nasdaq down -11.35%
- Russell 1000 down -2.66%
You can see $SIMO performed better than the broader market indexes. Rest assured that Wall Street traders and investors are also very aware of this. During market environments when the broader market indexes are trading lower it is customary for institutional portfolios to chase alpha.
Alpha is defined as the active return on an investment in comparison to a broader market index. $SIMO looks like an alpha play.
What were the worst-case drawdowns? The graphic below shows the roller coaster ride. Observe how $SIMO had large drawdowns which should’ve been anticipated based upon it annualized volatility which we just reviewed. $SIMO with an annualized volatility of 45%, traders and investors should expect that drawdowns amounting to values which are a large percentage of that metric.
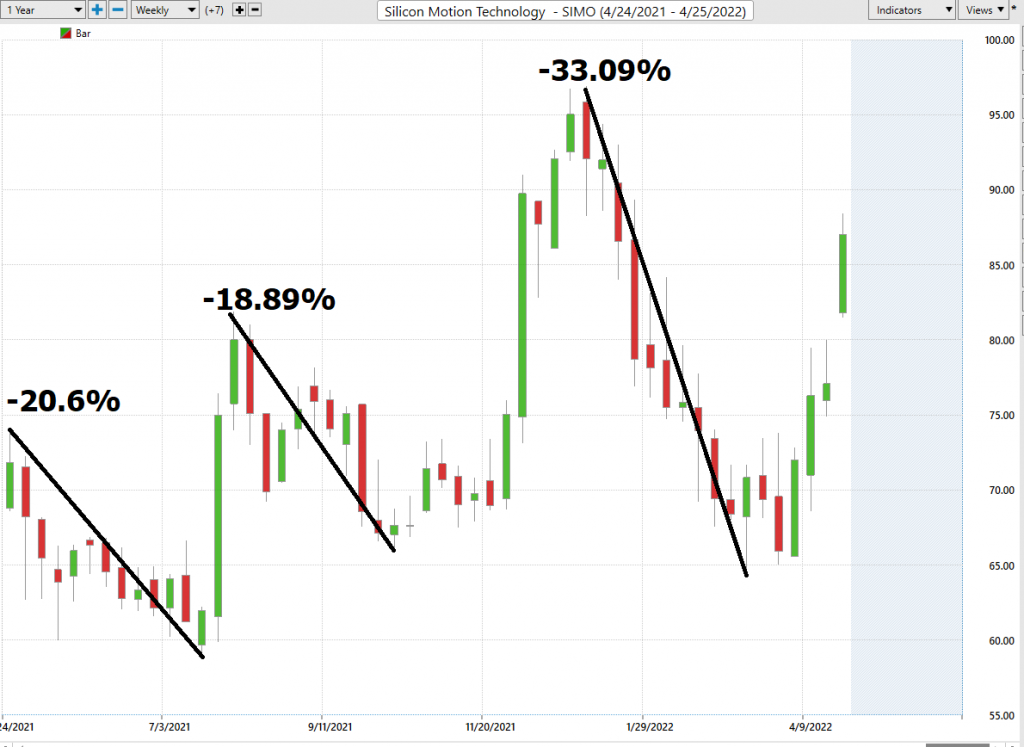
We would expect this type of volatility to continue. This means traders should anticipate wild swings in the market and pay attention to the a.i. forecast when we hit large drawdown levels from recent peaks.
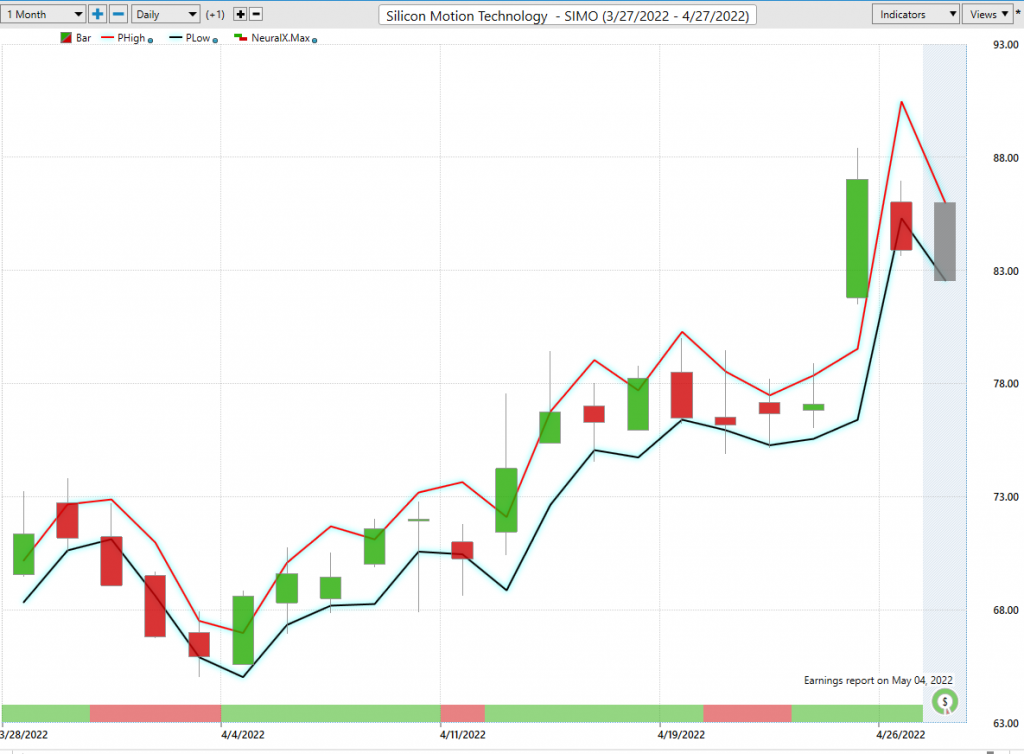
The Vantagepoint A.I. Analysis
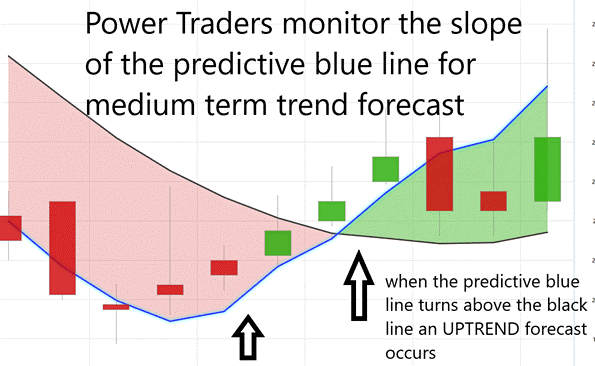
Using VantagePoint Software and the artificial intelligence, traders are alerted to trend forecasts by monitoring the slope of the predictive blue line. The black line is a simple 10 day moving average of price which simply tells you what has occurred in the market. The predictive blue line also acts as value zone where in uptrends traders try to purchase the asset at or below the blue line.
In studying the chart below, pay close attention to the relationship between the black line and predictive blue line. All that the black line tells you is what has occurred. It tells you where prices have been and what the average price over the last ten days is.
The predictive blue line, on the other hand utilizes that Vantagepoint patented Neural Network and Intermarket Analysis to arrive at its value. It looks at the strongest price drivers of an asset through artificial intelligence and statistical correlations to determine its value.
The TREND is clearly outlined in the following chart of $SIMO. Power Traders have done exceptionally well riding the stocks higher and lower over the last few months.
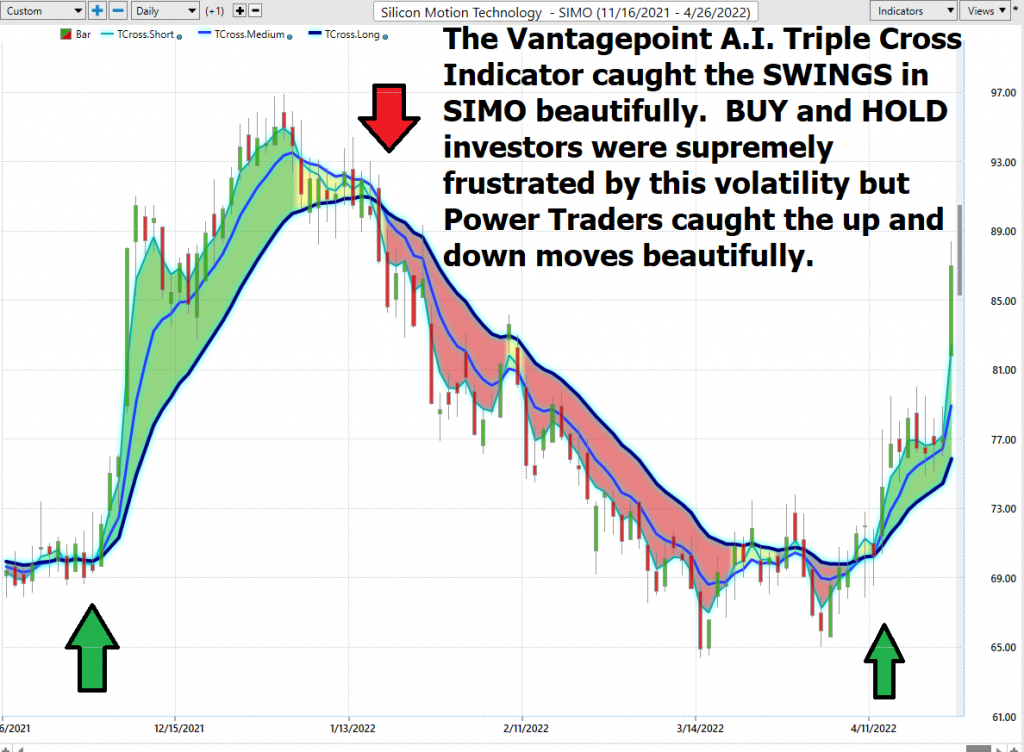
Whenever we see the predictive blue line move above the black line, we are presented with an UP-forecast entry opportunity. These are highlighted by UP arrows on the chart.
Whenever the predictive blue line moves below the black line, we are presented with a DOWN forecast. More importantly, there is no guesswork involved. Traders know where the value zone and trend are at all times.
Fine Tuning Entries with The Neural Net Indicator
At the bottom of the chart is the Neural Network Indicator which predicts future strength and/or weakness in the market. When the Neural Net Indicator is green it communicates strength. When the Neural Net is red it’s forecasting short term weakness in the market.
We advocate that Power Traders cross reference the chart with the predictive blue line and neural network indicator to create optimal entry and exit points.
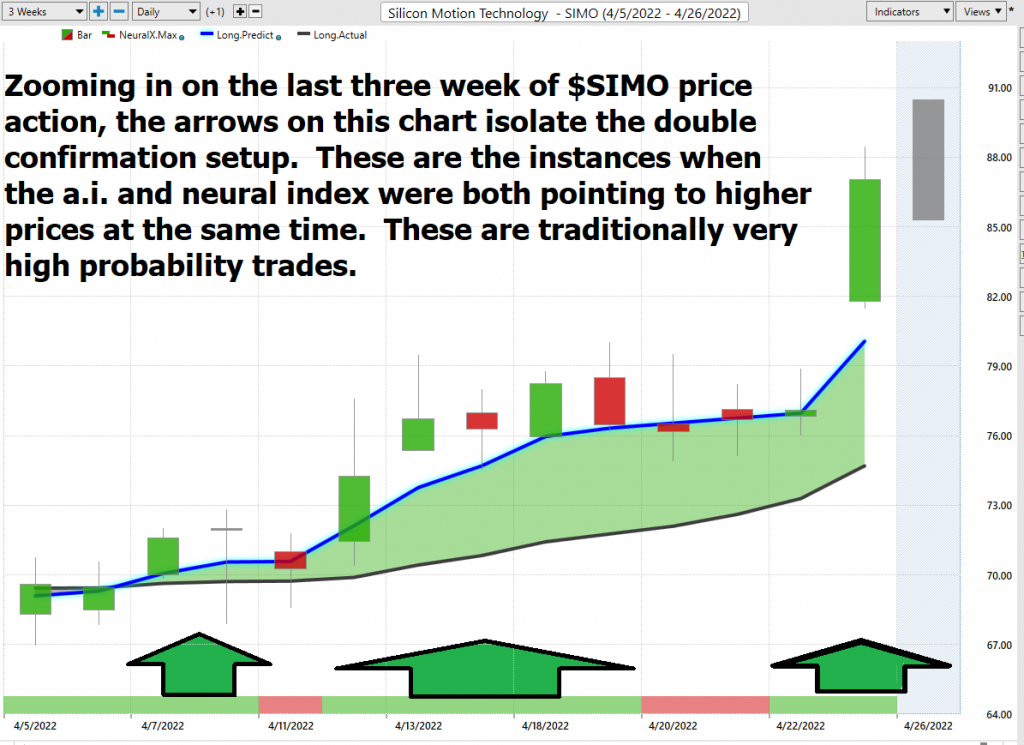
We advise Power Traders to cross reference the predictive blue line with the Neural Net for the best entry opportunities. Observe how the slope of the predictive blue line has remained positive from the time earnings were announced.
You can see in the chart above how the Neural Net offered several opportunities of double confirmation to Power Traders, when the predictive blue line and the Neural Net aligned with the same forecast. These instances provide extremely high probability trading opportunities to exploit the trend.
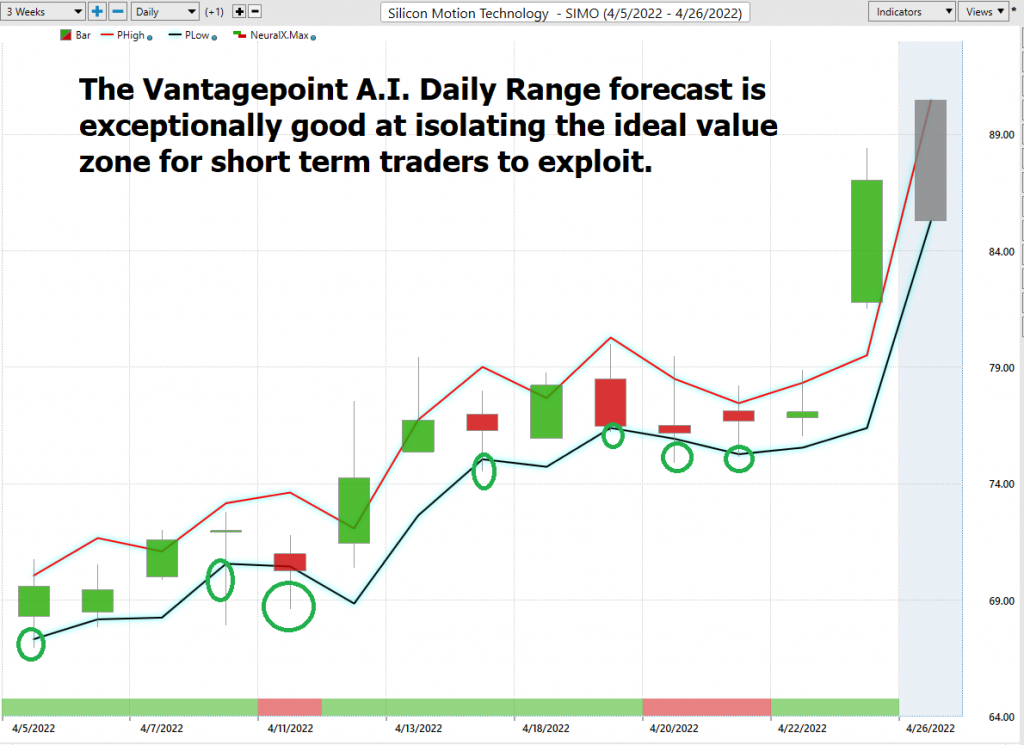
VantagePoint Software Daily Price Range Prediction
One of the powerful features in the Vantagepoint A.I. Software which Power Traders use daily is the Daily Price Range prediction forecast.
This forecast is what permits Power Traders to truly fine tune their entries and exits into the market.
What is the most important feature that traders are concerned about? Traders need to know where to enter and exit a market. VantagePoint provides this answer with exacting precision. Every day the Daily Range forecast is updated to provide insight to anticipated price action.
By cross-referencing the double confirmation setup with the daily range forecast Power Traders are alerted to swingh trading opportunities with exacting precision.
Intermarket Analysis
What makes the Vantagepoint Software extraordinary is its capacity to perform Intermarket analysis and to find those assets which are most statistically interconnected and are the key drivers of price.
Studying the charts can always provide objective realities in terms of locating support and resistance levels which become truly clear on a chart. But we live in a global marketplace. Everything is interconnected. The billion-dollar question for traders is always what are the key drivers of price for the underlying asset that I am trading?
These intangibles are invisible to the naked eye yet show extremely high statistical correlations.
Slight changes in Interest rates, Crude Oil Prices, and the Volatility of the dollar amongst thousands of other variables affect the decisions companies must make to survive in these challenging times. Trying to determine what these factors are is one of the huge problems facing investors and traders.
There is excellent value to be had in studying and understanding the key drivers of $SIMO’s price action.
By doing so you can often see which ETFs are acquiring $SIMO as well as uncovering other industries which affect $SIMO price movement.
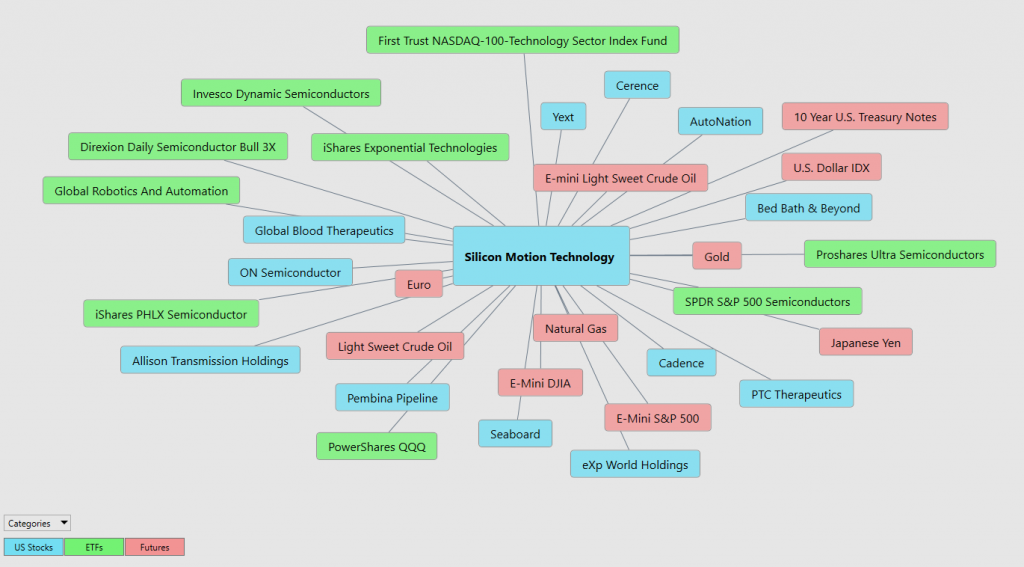
This can be invaluable information because it allows a trader to locate other opportunities and see a listing of the ETF’s that are also buyers of $SIMO. This knowledge is how other trading opportunities are often uncovered in their embryonic stages.
Suggestion
The trend is UP.
Momentum is UP. We expect the stock will encounter some initial resistance at its 52-week high at $96.89.
The Vantagepoint A.I. daily range forecast has been exceptional at highlighting short-term trading opportunities.
Option savvy traders could consider selling PUT options and collecting the increased premiums based upon the high annualized volatility that we are seeing in $SIMO.
$SIMO has handily beat all of the broader stock market indexes and will continue to attract investors and traders aware of this “alpha” characteristic.
We like the idea of looking for buying opportunities of $SIMO on dips and breaks which we expect to occur on a regular basis.
The predictive blue line is the guidance that we will be following. $SIMO is clearly a chasing ALPHA play based upon its performance over the last 12 months.
Our advice: Follow the a.i. trend analysis and practice good money management on all your trades.
With earnings on May 4, 2022, we expect some great swing trading opportunities.
We will re-evaluate this analysis based upon:
- Wall Street Analysts’ Estimates
- 52-week high and low boundaries
- Vantagepoint A.I. Forecast (Predictive Blue Line)
- Neural Network Forecast
- Daily Range Forecast
- Intermarket Analysis
Let’s Be Careful Out There!
Remember, It’s Not Magic.
It’s Machine Learning.

IMPORTANT NOTICE!
THERE IS SUBSTANTIAL RISK OF LOSS ASSOCIATED WITH TRADING. ONLY RISK CAPITAL SHOULD BE USED TO TRADE. TRADING STOCKS, FUTURES, OPTIONS, FOREX, AND ETFs IS NOT SUITABLE FOR EVERYONE.
DISCLAIMER: STOCKS, FUTURES, OPTIONS, ETFs AND CURRENCY TRADING ALL HAVE LARGE POTENTIAL REWARDS, BUT THEY ALSO HAVE LARGE POTENTIAL RISK. YOU MUST BE AWARE OF THE RISKS AND BE WILLING TO ACCEPT THEM IN ORDER TO INVEST IN THESE MARKETS. DON’T TRADE WITH MONEY YOU CAN’T AFFORD TO LOSE. THIS ARTICLE AND WEBSITE IS NEITHER A SOLICITATION NOR AN OFFER TO BUY/SELL FUTURES, OPTIONS, STOCKS, OR CURRENCIES. NO REPRESENTATION IS BEING MADE THAT ANY ACCOUNT WILL OR IS LIKELY TO ACHIEVE PROFITS OR LOSSES SIMILAR TO THOSE DISCUSSED ON THIS ARTICLE OR WEBSITE. THE PAST PERFORMANCE OF ANY TRADING SYSTEM OR METHODOLOGY IS NOT NECESSARILY INDICATIVE OF FUTURE RESULTS. CFTC RULE 4.41 – HYPOTHETICAL OR SIMULATED PERFORMANCE RESULTS HAVE CERTAIN LIMITATIONS. UNLIKE AN ACTUAL PERFORMANCE RECORD, SIMULATED RESULTS DO NOT REPRESENT ACTUAL TRADING. ALSO, SINCE THE TRADES HAVE NOT BEEN EXECUTED, THE RESULTS MAY HAVE UNDER-OR-OVER COMPENSATED FOR THE IMPACT, IF ANY, OF CERTAIN MARKET FACTORS, SUCH AS LACK OF LIQUIDITY. SIMULATED TRADING PROGRAMS IN GENERAL ARE ALSO SUBJECT TO THE FACT THAT THEY ARE DESIGNED WITH THE BENEFIT OF HINDSIGHT. NO REPRESENTATION IS BEING MADE THAT ANY ACCOUNT WILL OR IS LIKELY TO ACHIEVE PROFIT OR LOSSES SIMILAR TO THOSE SHOWN.

