
One of the fascinating things that occurs in markets is that from time to time you can spot money flowing from one sector to another. Sometimes this occurs because of technological or regulatory development. But sometimes it is investors and traders moving money based upon growth and valuation prospects for different stocks.
Currently, the S&P 500 Index is trading at 22.23 times earnings. With interest rates at 5.25% on the short end of the yield curve many fundamental traders consider this price level on the S&P to be fairly overvalued. If this assessment is correct, money managers start looking for undervalued sectors to invest and trade in. In our estimation, this is exactly what has occurred in the Biotech Sector.
The Biotech sector is currently trading at 17.36 times earnings. This means that investors are willing to pay $17.36 for one dollar of earnings. This is significantly lower than the $22.23 multiple on the S&P 500 Index.
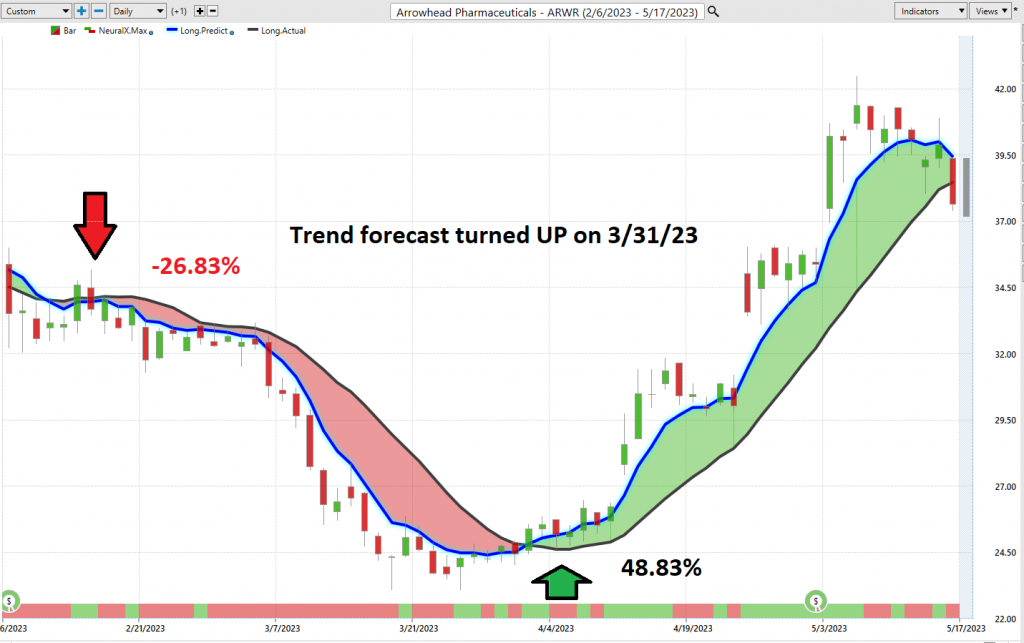
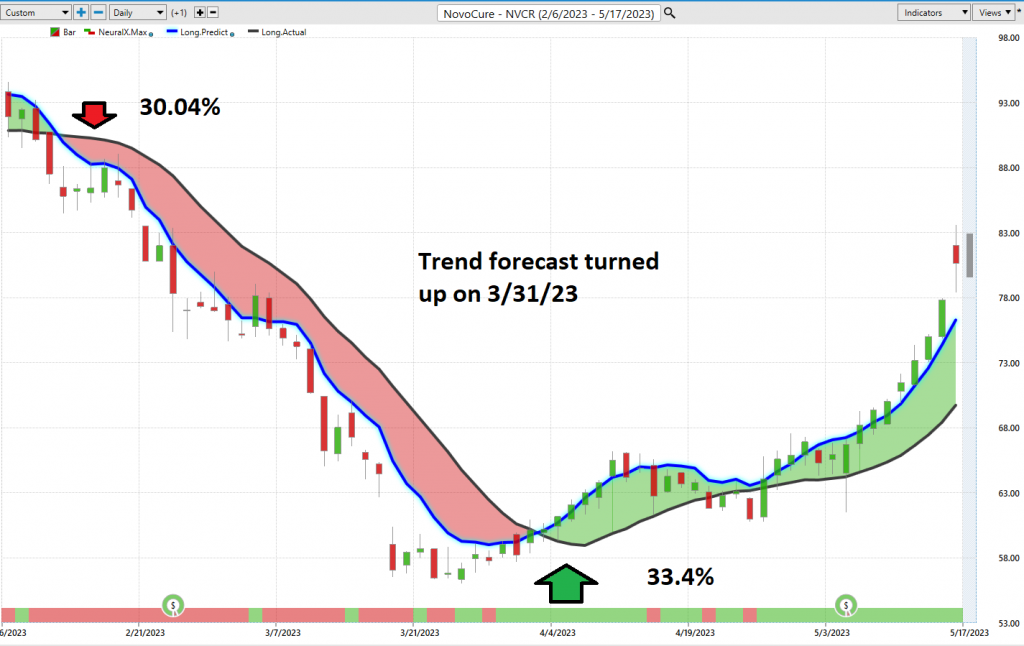
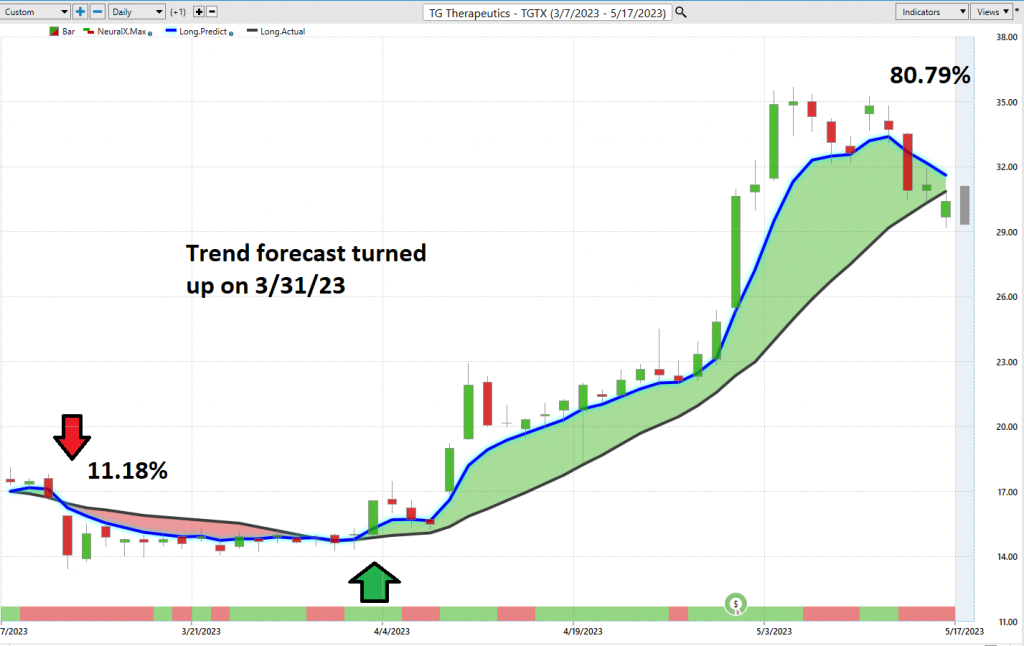
Over the last several weeks the artificial intelligence has navigated numerous BIOTECH stocks with exacting precision. We are going to look at $ARWR, $NVCR and $TGTX as examples in this stock study. As you peruse these three charts notice that even though the magnitude of the trends is wildly different the time frames are almost identical. Meaning that the artificial intelligence, neural networks, and intermarket analysis forecasted trend changes on similar dates. While we are not fundamental traders or investors all three of these biotech stocks are outliers from a price-to-earnings ratio perspective. Meaning that these companies are losing money, awaiting regulatory approval and from a valuation level are extremely undervalued.
The price-to-earnings ratio of $ARWR is -198.1.
$NVCR as of May 2023 has a price-to-earnings ratio of -56.
TGTX has a price-to-earnings ratio of -25.1138
It is common for Price to Earnings ratios in the biotech sector after regulatory approval to move to a level of 1,000 or greater. These trends in companies that are losing money indicate that we are witnessing an outlier value play in the biotech sector.
Since investing/trading in individual biotech stocks can be high risk we will then focus on the SPDR S&P 500 Biotech ETF. Biotech stocks are significantly more volatile than traditional stocks because before they can achieve significant momentum, they traditionally require massive amounts of funding, and they must perform lengthy clinical trials and await FDA approval. Since the timeframe from a product launch to market acceptance can be lengthy numerous existing products can be rendered worthless if the company is incapable of keeping pace with technological innovation and change.
In this weekly stock study, we will look at and analyze the following indicators and metrics as are our guidelines for the SPDR S&P Biotech ETF $XBI.
- 52-week high and low boundaries
- Best Case – Worst Case Analysis and Takeaways
- Vantagepoint A.I. Forecast (Predictive Blue Line)
- Neural Network Forecast
- Vantagepoint A.I. Daily Range Forecast
- Intermarket Analysis
- Our trading suggestion
We don’t base decisions on things like earnings or fundamental cash flow valuations. However, we do look at them to better understand the financial landscape that a company is operating under.
52-Week High and Low Boundaries
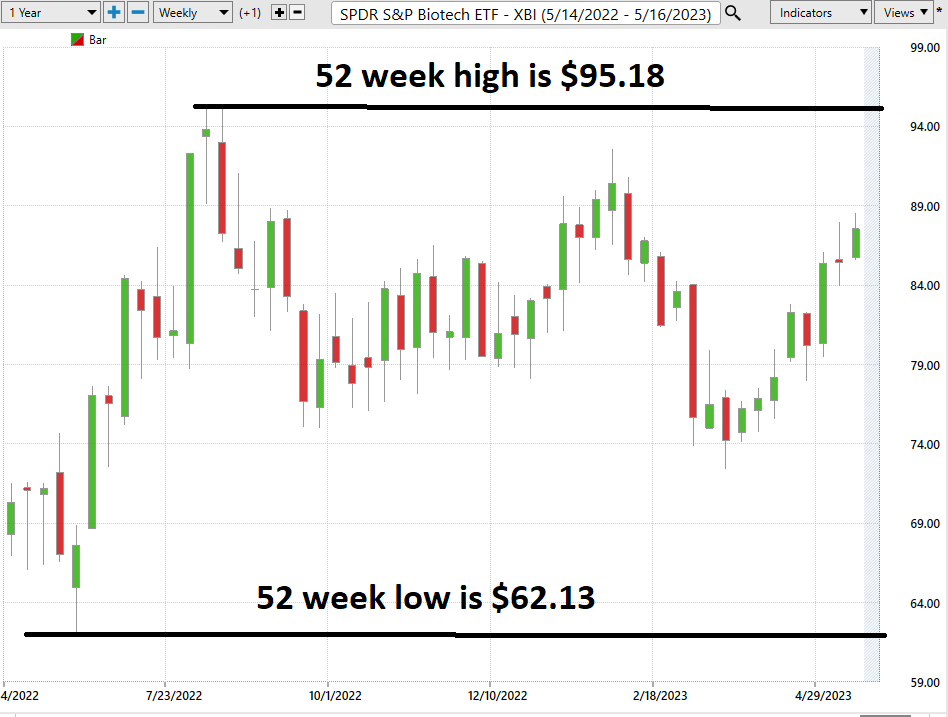
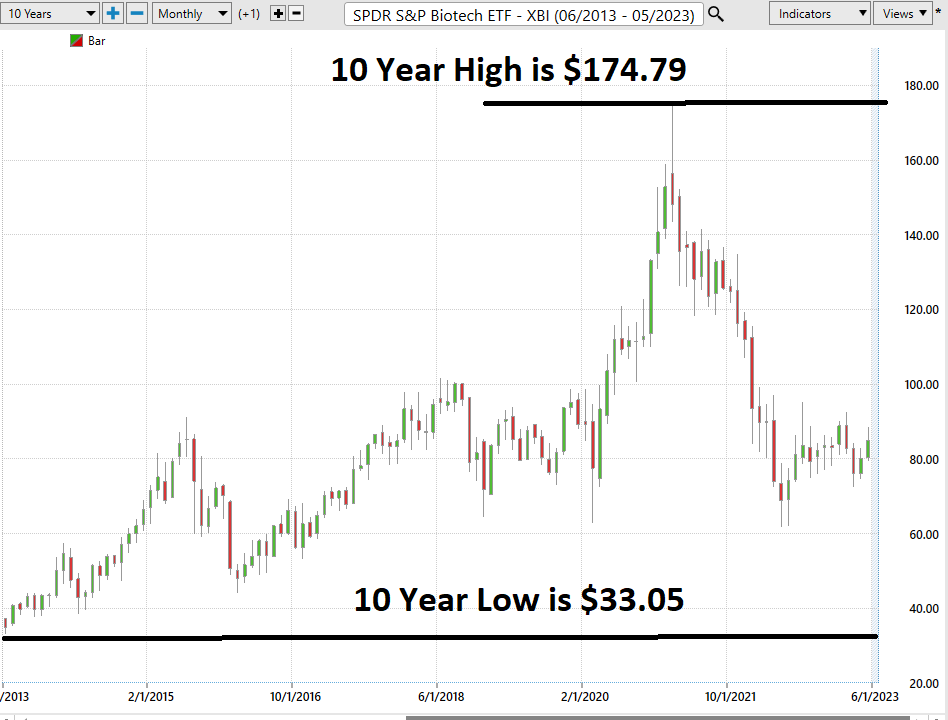
A careful examination of the long-term chart of the SPDR S&P Biotech ETF ($XBI) unveils the 52-week boundaries that are critical to our analysis.
Throughout the last year, the SPDR S&P Biotech ETF ($XBI) has seen lows of $62.13 and highs of $95.18, resulting in an annual trading range of $33.05. At present, the ETF is trading within the 69th percentile of this range.
To delve further into this, I find it useful to analyze the current price against the annual trading range to ascertain an estimate of annualized volatility. This measure can give us a gauge of what to anticipate over the forthcoming 12 months, provided market conditions echo the past year.
Currently, the annualized volatility for the SPDR S&P Biotech ETF ($XBI) clocks in at 38.9%, a figure that falls on the lower end of the spectrum for the biotech sector. It’s crucial for us, as cautious traders, to grasp the concept of annualized statistical volatility. This tool helps us quantify and predict potential future market movements. A higher annualized statistical volatility implies a more volatile stock, suggesting greater potential for upward or downward motion. However, it’s important to note that this is just one piece of the puzzle, and relying solely on this figure when evaluating a stock’s performance may lead to an incomplete picture. Nevertheless, understanding this metric can offer valuable insight into a stock’s trajectory, both past and present.
A glance at the chart shows us the roller-coaster ride the ETF has been on, reflecting the challenging year for biotech companies. This narrative is further corroborated when we examine the 10-year monthly chart, which shows a high of $174.79 and a low of $33.05. The SPDR S&P Biotech ETF ($XBI) experienced a significant sell-off of 63.9% from its 10-year highs before finding its footing and rebounding.
We must tread carefully, keep our wits about us, and never lose sight of the analytical rigor that underpins our trading decisions.
Best Case – Worst Case Scenario
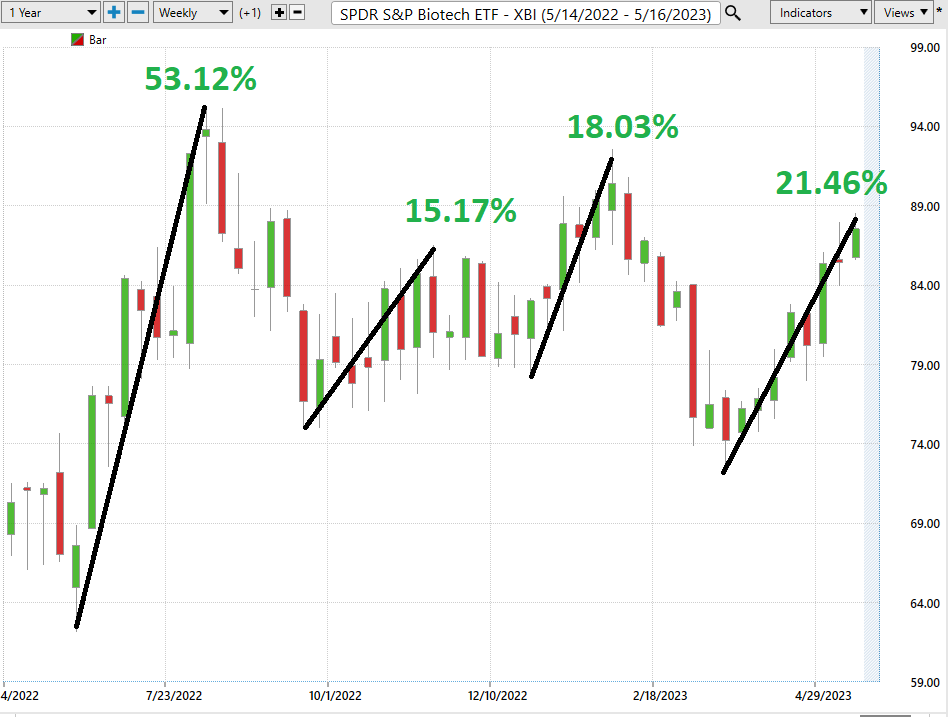
A careful examination of the long-term 52-week chart can provide us with a snapshot of the possible best and worst outcomes, offering a glimpse into the risk and volatility of this asset. This type of analysis is always beneficial before making any investment or trade to understand the historical risks and rewards. Essentially, what we aim to measure is the rate and pace at which the stock has traveled between its highs and lows within a year. This baseline analysis is invaluable as it visually demonstrates the speed of a stock’s decline relative to its ascent.
First, we do the Best-Case analysis:
Followed by the WORST-CASE Analysis:
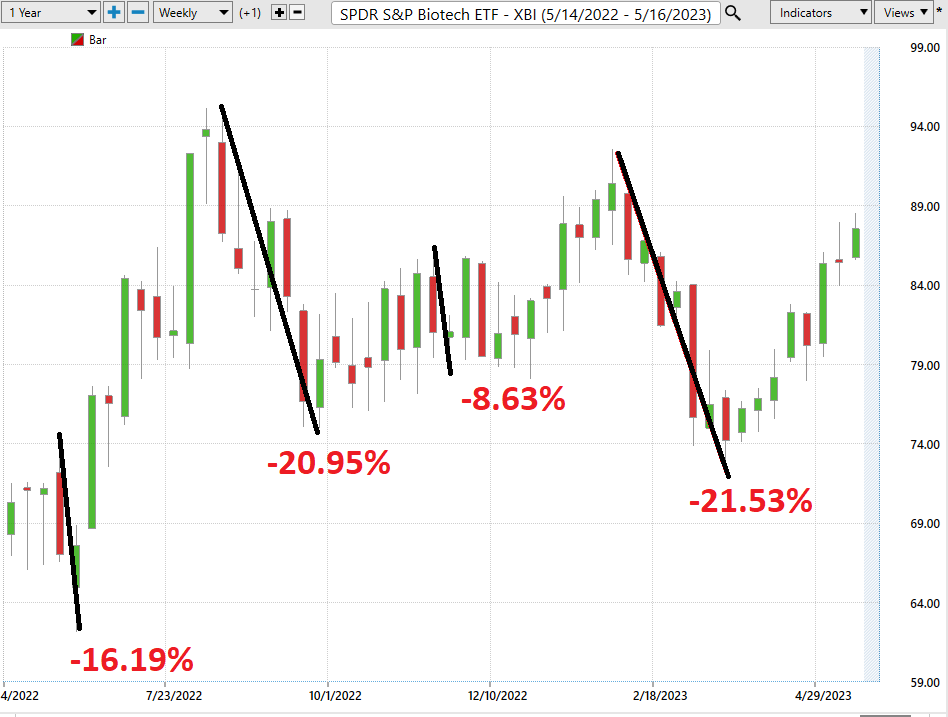
This initial analysis lets us see how quickly SPDR S&P Biotech ETF ($XBI) falls in comparison to its rallies. In this regard we can quickly see that the vast majority of the declines and rallies stayed within the statistical volatility boundary of 38.9%.
Next, we want to compare the performance of SPDR S&P Biotech ETF ($XBI) to the major broad market indexes.
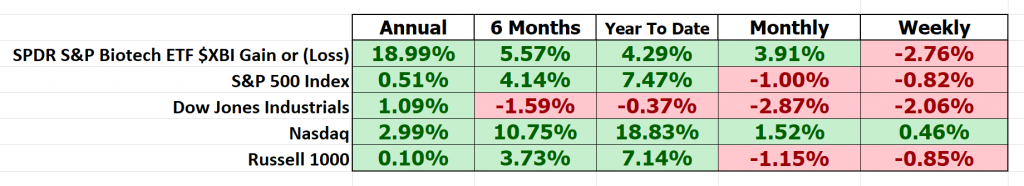
So, in SPDR S&P Biotech ETF ($XBI) we have an asset that is more volatile than the broader market but has also outperformed the broader stock market indexes.
Vantagepoint A.I. Forecast (Predictive Blue Line)
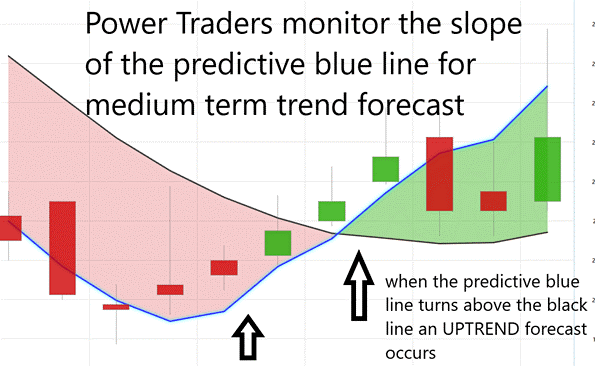
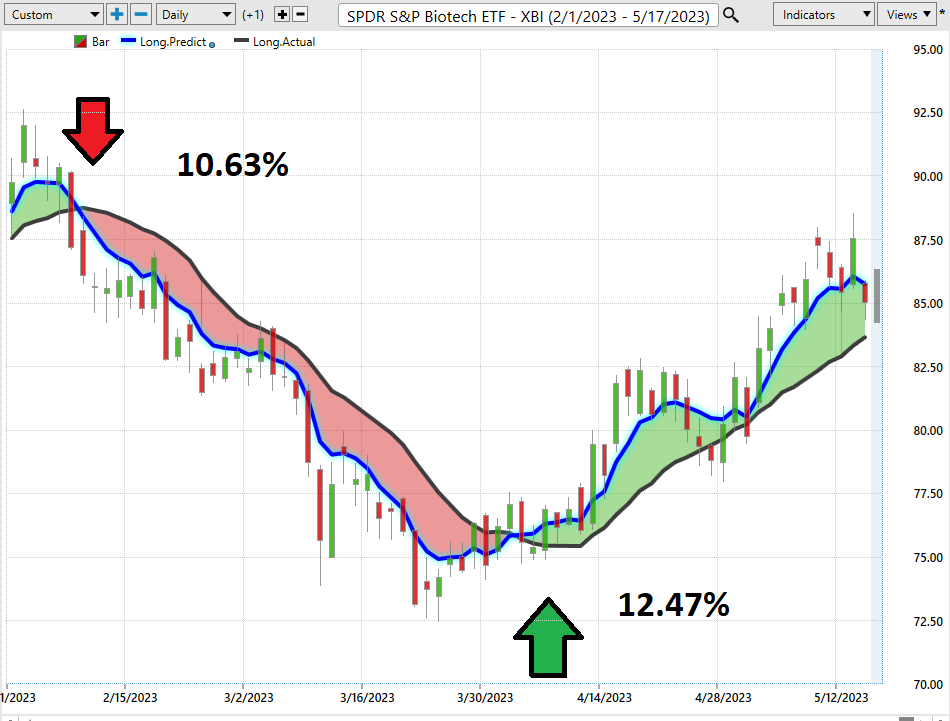
On the following chart you will see the power of the VantagePoint Predictive blue line which determines the medium-term trend price forecast.
The guidelines we abide by are as follows:
- The slope of the predictive blue line determines the trend forecast and general direction of SPDR S&P Biotech ETF ($XBI)
- Ideally, the VALUE ZONE is determined to try and find buy opportunities at or below the predictive blue line, or to sell opportunities above the predictive blue line during a downtrend.
Naturally when the predictive blue line slopes lower traders would be anticipating lower prices and either moving to the sidelines or hedging their positions.
Using VantagePoint Software and artificial intelligence, traders are alerted to trend forecasts by monitoring the slope of the predictive blue line.
The predictive blue line, however, utilizes the VantagePoint-patented Neural Network and Intermarket Analysis to arrive at its value. It looks at the strongest price drivers of an asset through artificial intelligence and statistical correlations to determine its value.
The blue line ALWAYS determines the forecast and the best move forward.
Neural Network Indicator (Machine Learning)
The Neural Network Indicator, located at the bottom of the chart, serves as a reliable tool for predicting the near-term strength or weakness in the market. When the indicator is green, it signifies strength, while a red indicator indicates an anticipated short-term weakness. A yellow indicator suggests that the market is expected to move sideways. A Neural Net is a sophisticated learning system that utilizes a network of functions to process vast amounts of data and consistently improve its performance. It effectively translates data into desired outputs, making it a valuable tool for traders seeking accurate market analysis. By incorporating neural networks into trading strategies, traders can identify patterns and anticipate market changes with precision. This technological advancement has gained popularity among financial traders, offering unique insights that traditional trading approaches often overlook. Moreover, neural networks consider various external factors, such as volume and volatility, resulting in highly accurate predictions. They are equally beneficial for both manual and automated trading strategies across diverse asset classes. Traders are encouraged to use the predictive blue line and neural network indicator in conjunction with the chart to optimize their entry and exit points. Neural networks represent the future of trading tools, allowing traders to identify intricate patterns and interdependencies that traditional methods fail to recognize. By using the Neural Net as confirmation, traders can make informed decisions and seize profitable opportunities in the market.
We advocate that Power Traders cross reference the chart with the predictive blue line and neural network indicator to create optimal entry and exit points.
For the serious trader, neural networks are a next-generation trading tool that can detect subtle non-linear interdependencies and patterns that traditional methods of technical analysis are unable to uncover.
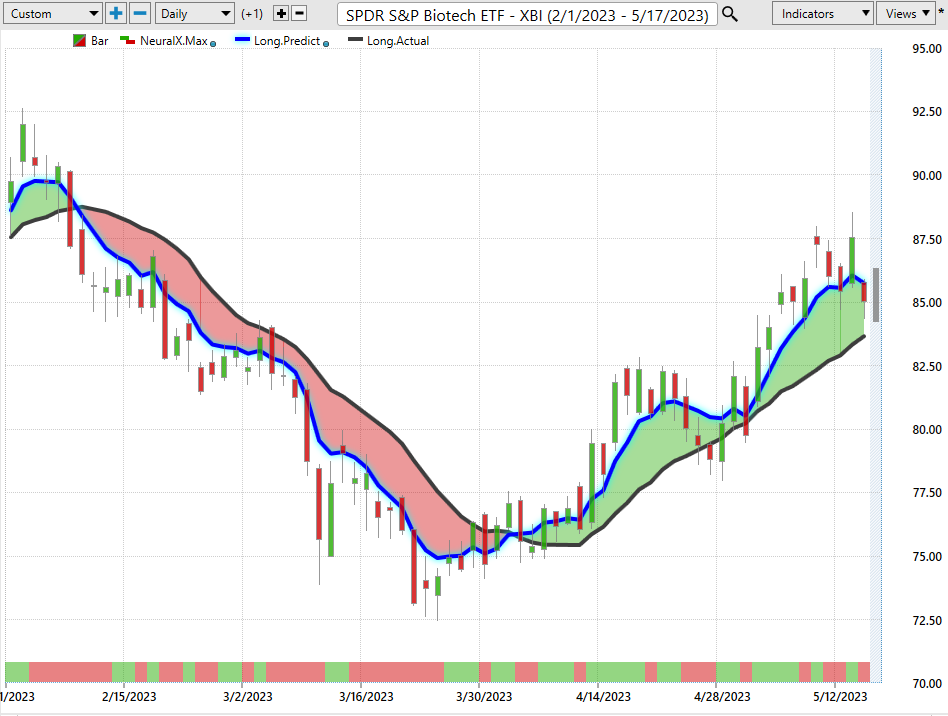
Traders look for confirmation on Neural Net to position themselves LONG or SHORT in the market. In other words, when the A.I. forecast is green, and the Neural Net is green, that presents a buying opportunity.
The inverse is also true, when the A.I. forecast is red and the Neural Net is red, that is a selling opportunity. The arrows on the chart below highlight the trading zones where Power Traders would’ve been using double confirmation to BUY in cross referencing the A.I. forecast with the NeuralNet.
Power Traders are always looking to apply both the Neural Network and A.I. to the markets to find statistically sound trading opportunities.
Vantagepoint A.I. Daily Range Forecast
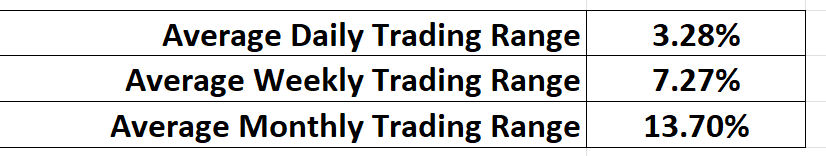
Here is the broad range of trading metrics over the past year for the $XBI.

These metrics tell you statistically what has occurred. What traders must always do is determine how to put this knowledge into action.
SPDR S&P Biotech ETF ($XBI) offers plenty of opportunity, but this asset is risky for traders that are unaware of how to harness volatility.
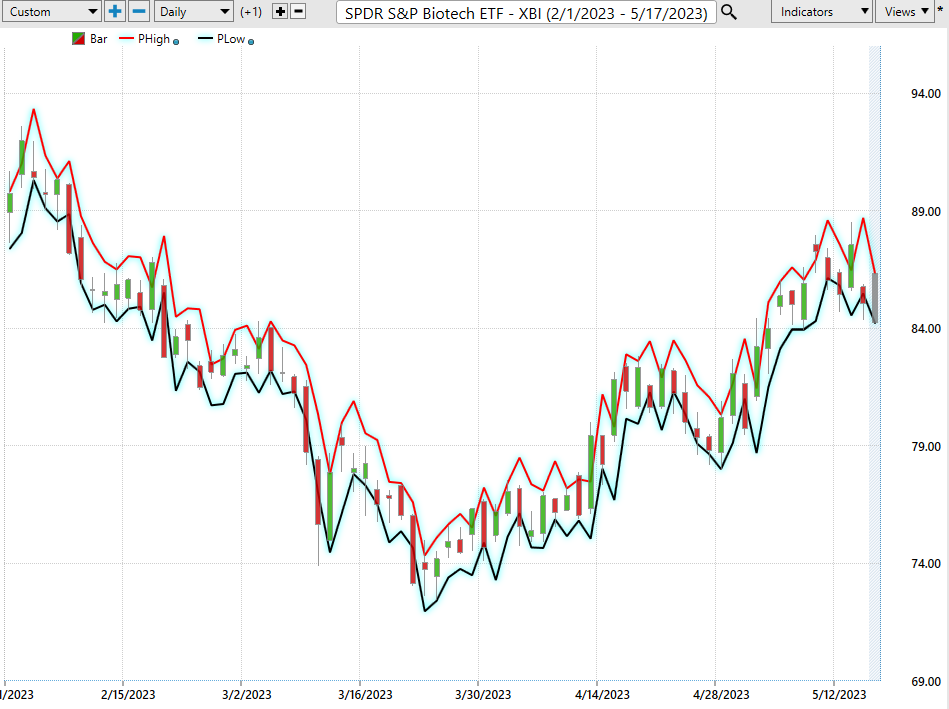
One of the remarkable features offered by the VantagePoint Software, which is highly valued by Power Traders, is the Price Range prediction forecast. This particular forecast plays a vital role in assisting traders in refining their entry and exit points with precision.
On a daily basis, traders grapple with the challenge of determining optimal buy and sell areas in the market. Fortunately, VantagePoint’s A.I. simplifies this decision-making process through its reliable Daily Price Range Forecast.
For short-term traders, the crucial questions they face include where to initiate their positions, where to set their stop-loss orders, and where to execute their sell orders. The Daily Price Range forecast provided by VantagePoint serves as a valuable resource in addressing these critical trading queries.
To gain a deeper understanding, I encourage you to carefully study the VantagePoint Daily Range Forecast chart below. Observe how the software delivers precise guidance to short-term traders, enabling them to make well-informed trading decisions. With VantagePoint, traders can navigate the markets with confidence and enhance their chances of success.
Intermarket Analysis
In the world of trading, power lies in our responses to the truths we understand. Among the numerous significant questions traders encounter, one that stands out is the driving force behind price movements. While headlines often captivate with their intriguing narratives, they merely stimulate our imagination. Traders, on the other hand, seek a comprehensive understanding of the cause-and-effect dynamics of price fluctuations.
To shed light on this crucial matter, intermarket analysis emerges as an indispensable tool in the financial markets. This analytical approach enables traders to examine statistical price correlations across various asset classes. Given the global nature of our marketplace and the intricate interconnectedness of everything within it, intermarket analysis holds paramount importance.
Accomplished traders, who strive to maintain a competitive edge and capitalize on market opportunities, recognize the immense value of intermarket analysis. By discerning correlations between specific assets and economic news, these traders gain insight into potential trends and can readily adapt their strategies. Therefore, any trader aspiring to enhance prediction accuracy and boost profits should undoubtedly acquaint themselves with intermarket analysis, as it has the potential to transform their trading experience entirely.
Furthermore, for investors and traders seeking to identify the key price drivers of an asset, intermarket analysis serves as a potent tool. It entails analyzing the interrelationships between different markets, such as stocks, commodities, currencies, and bonds, to uncover correlations that influence asset prices. By comprehending how changes in one market can reverberate through others, traders can anticipate price movements more effectively. Additionally, intermarket analysis encourages the consideration of broader economic trends when forecasting the performance of individual assets, facilitating more informed decision-making.
In today’s complex financial environment, intermarket analysis assumes increasing importance, enabling investors to stay ahead in their trading endeavors. Factors such as interest rates, crude oil prices, and the volatility of the dollar, among numerous other variables, significantly impact the decisions companies must make to thrive in these challenging times. Consequently, discerning these influential factors presents a monumental challenge for investors and traders alike.
Ultimately, the choice is yours. You can succumb to the rhetoric of media talking heads, who often propagate fear-inducing talking points. Alternatively, you can rely on factual information to inform your decision-making process, allowing for more calculated and grounded choices.
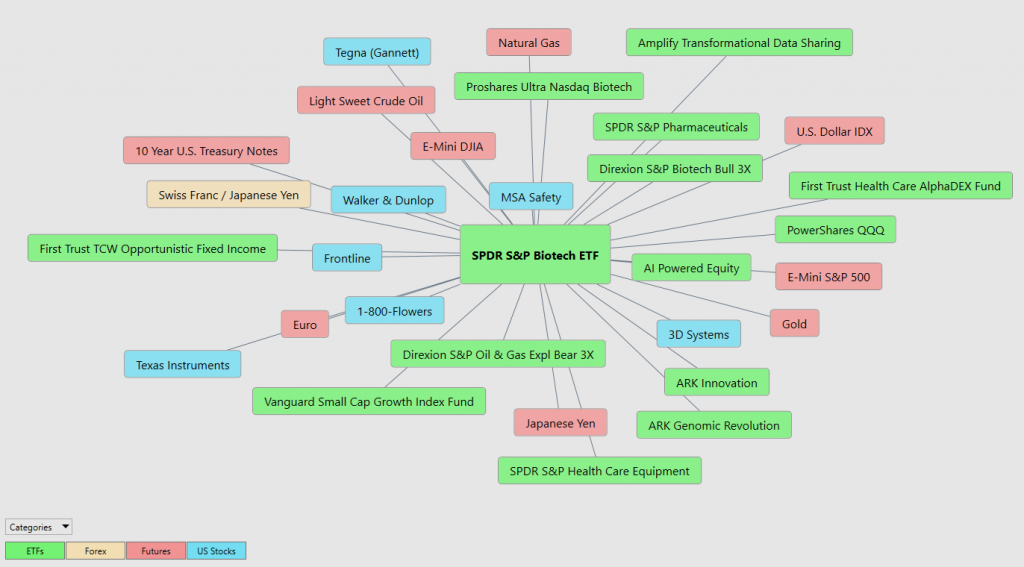
Within the Intermarket Analysis graphic, you will see the 31 markets that are the key drivers to SPDR S&P Biotech ETF ($XBI)’s price.
There is great value to be had in studying and understanding the key drivers of SPDR S&P Biotech ETF ($XBI)’s price action. This graphic provides a microcosmic view of what factors have been driving SPDR S&P Biotech ETF ($XBI)’s higher. You will find a handful of biotech and pharmaceutical ETF’s whose price action is very statistically correlated to SPDR S&P Biotech ETF ($XBI).
Our Suggestion
Charts are the footprints of money flows.
When it comes to analyzing the stock market, professionals know that charts provide insight into the movement of money. This can prove valuable in giving traders a competitive advantage. What does it really mean when a trader says, “charts are the footprints of money flows”? It means that with careful analysis, artificial intelligence, machine learning and neural networks can track trends and look for clues about how money is flowing in and out of markets. By doing so, traders can often develop strategies based on specific levels of support and resistance or identify points where they may enter or exit trades. Charts tell us a lot more than just where prices have been – they capture information to allow us to make informed trading decisions.
At present, we think $XBI deserves to be on your radar. The volatility presents great short term trading opportunity. Since our duration is short term in nature, we prefer to wait till the price reaches a lower point in the trading envelope and will wait for further guidance from the a.i.
Our recommendation is to follow the A.I. trend analysis as outlined in this stock study and practice good money management on all trades.
We will re-evaluate daily based upon:
- New 52-week high and low boundaries
- Vantagepoint A.I. Forecast (Predictive Blue Line)
- Neural Network Forecast
- Daily Range Forecast
The trend in SPDR S&P Biotech ETF ($XBI) is UP. We will look to the bottom of the daily range forecast to position ourselves LONG with tight stops for short-term trades.
Let’s Be Careful Out There!
It’s Not Magic.
It’s Machine Learning.

IMPORTANT NOTICE!
THERE IS SUBSTANTIAL RISK OF LOSS ASSOCIATED WITH TRADING. ONLY RISK CAPITAL SHOULD BE USED TO TRADE. TRADING STOCKS, FUTURES, OPTIONS, FOREX, AND ETFs IS NOT SUITABLE FOR EVERYONE.
DISCLAIMER: STOCKS, FUTURES, OPTIONS, ETFs AND CURRENCY TRADING ALL HAVE LARGE POTENTIAL REWARDS, BUT THEY ALSO HAVE LARGE POTENTIAL RISK. YOU MUST BE AWARE OF THE RISKS AND BE WILLING TO ACCEPT THEM IN ORDER TO INVEST IN THESE MARKETS. DON’T TRADE WITH MONEY YOU CAN’T AFFORD TO LOSE. THIS ARTICLE AND WEBSITE IS NEITHER A SOLICITATION NOR AN OFFER TO BUY/SELL FUTURES, OPTIONS, STOCKS, OR CURRENCIES. NO REPRESENTATION IS BEING MADE THAT ANY ACCOUNT WILL OR IS LIKELY TO ACHIEVE PROFITS OR LOSSES SIMILAR TO THOSE DISCUSSED ON THIS ARTICLE OR WEBSITE. THE PAST PERFORMANCE OF ANY TRADING SYSTEM OR METHODOLOGY IS NOT NECESSARILY INDICATIVE OF FUTURE RESULTS. CFTC RULE 4.41 – HYPOTHETICAL OR SIMULATED PERFORMANCE RESULTS HAVE CERTAIN LIMITATIONS. UNLIKE AN ACTUAL PERFORMANCE RECORD, SIMULATED RESULTS DO NOT REPRESENT ACTUAL TRADING. ALSO, SINCE THE TRADES HAVE NOT BEEN EXECUTED, THE RESULTS MAY HAVE UNDER-OR-OVER COMPENSATED FOR THE IMPACT, IF ANY, OF CERTAIN MARKET FACTORS, SUCH AS LACK OF LIQUIDITY. SIMULATED TRADING PROGRAMS IN GENERAL ARE ALSO SUBJECT TO THE FACT THAT THEY ARE DESIGNED WITH THE BENEFIT OF HINDSIGHT. NO REPRESENTATION IS BEING MADE THAT ANY ACCOUNT WILL OR IS LIKELY TO ACHIEVE PROFIT OR LOSSES SIMILAR TO THOSE SHOWN.

