
![]()
Founded in 1902, Target Corp. is a Minnesota-based general merchandise retailer and has stores in all 50 U.S. states and the District of Columbia. Its stores offer curated general merchandise and food assortments including perishables, dry grocery, dairy, and frozen items. It also has fashion, clothing, and cosmetics.
Currently, Target ($TGT) has over 1926 retail outlets as of the end of 2021. It is ranked number 37 on the Fortune 500 list of largest corporations by revenue.
Over the past two years Target has been very effective in addressing and overcoming pandemic related challenges. The national brand has seen a 12% growth in store traffic and a 45% increase in same day services which include delivery and curbside pickup.
In terms of price performance year over year, Target has outperformed its sector – the S&P 500 Consumer Discretionary Index. While Target is up 18.8%, the index is only up 3.4% over the same period. This has led numerous Wall Street Analysts to feature $TGT and rate it an outperform compared to the rest of the retailing sector.
In its most recent quarterly results, Target’s revenue and earnings saw robust growth. Revenue rose 9.4% year-over-year to $31 billion, its earnings stood at $3.19 per share, up 19.2% from the same quarter last year.
Target has also entered into licensing and strategic partnerships with Disney, Apple, and Ulta Beauty all in the hopes of enhancing its merchandise offerings and boosting store foot traffic.
Investors looking at longer term trading find $TGT extremely attractive because:
- Earnings are forecast to grow 3.62% per year moving forward
- Earnings grew by 59.2% over the past year
- $TGT pays a reliable dividend of 1.46%
- TGT’s earnings have grown significantly by 20.2% per year over the past 5 years
- TGT’s earnings growth over the past year (59.2%) exceeds its 5-year average (20.2% per year)
- TGT earnings growth over the past year (59.2%) exceeded the Retail industry -5.2%
Target has a market cap of $114.4 billion and trades average volume of 4.2 million shares per day. Its next earnings call is scheduled for May 17, 2022.
In this weekly stock study, we will look at and analyze the following indicators and metrics as are our guidelines which dictate our behavior in deciding whether to buy, sell, or stand aside on a particular stock.
- Wall Street Analysts’ Estimates
- 52-week high and low boundaries
- Vantagepoint A.I. Forecast (Predictive Blue Line)
- Neural Network Forecast
- Daily Range Forecast
- Intermarket Analysis
- Our trading suggestion
We don’t base our trading decisions on things like earnings or fundamental cash flow valuations. However, we do look at them to better understand the financial landscape that a company is operating under.
Analysts Ratings
Based on 21 Wall Street analysts offering 12-month price targets for Target in the last 3 months. The average price target is $278.63 with a high forecast of $353.00 and a low forecast of $230.00. The average price target represents a 13.24% change from the last price of $246.05.
Power Traders love to see this type of divergent opinion on a stock that is widely traded. $TGT has had huge momentum. It’s become a favorite stock of swing traders particularly after earnings announcements.
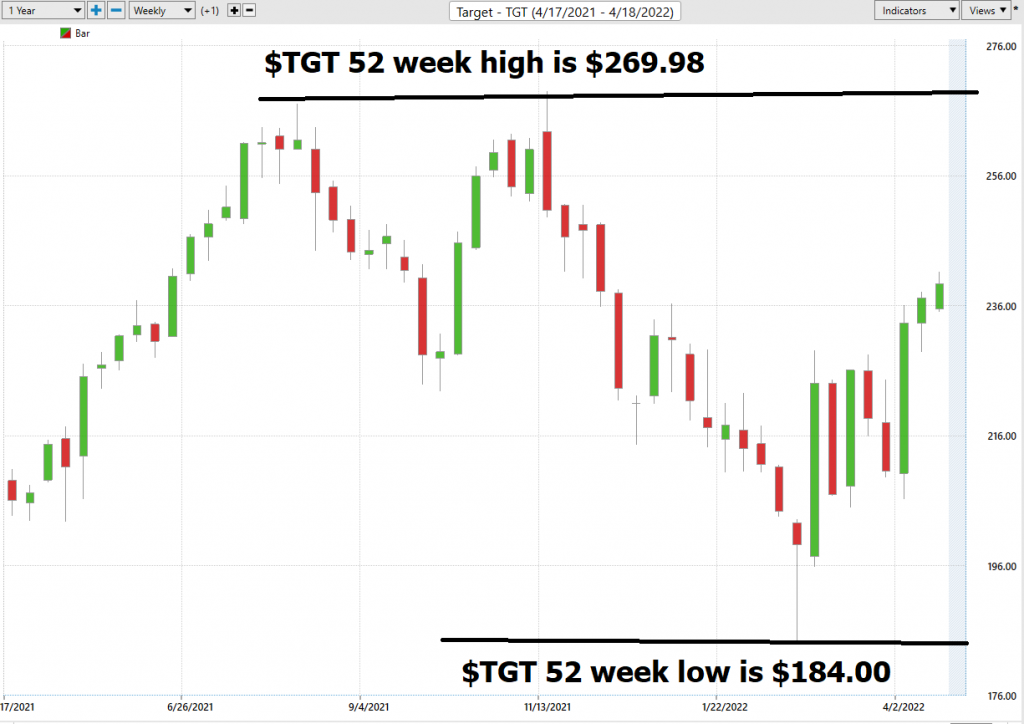
52-week High-Low Chart
Over the last 52 weeks $TGT has traded as high as $268.98 and as low as $184. This provides us with an annual trading range of about $85. When we divide this metric by 52 weeks, we can determine that the average weekly trading range for $TGT is $1.63. What we often like to do as well is to divide the annual trading range ($85) by the current price ($246.05) to provide us with a basic and generic calculation of how the annualized volatility for $TGT, which is currently 34.5%. This measurement of volatility tells us that if the future is like the recent past, we can anticipate that NORMAL would be defined as $TGT trading as high as $331.05 and as low as $161.07.
We refer to these as the commonsense metrics which we use as baseline measurements of understanding normal value. When using artificial intelligence, we look to amplify our returns based upon these baseline measurements.
Whenever we trade, we always pay attention to where we are in relation to the 52-week trading range. It is common to see the 52-week high provide very strong resistance to the market until it is breached. Often when the 52-week high is breached we will see the stock price explode higher very quickly over a very short period.
We like to place all these values on the chart just to get an idea of historical price action. The median Wall Street Analysts ratings at $278.63 per share is above the 52-week high which we think also bodes very well for future price action.
$TGT is trading well below its 52-week high and looks like ti will challenge that level in the coming months.
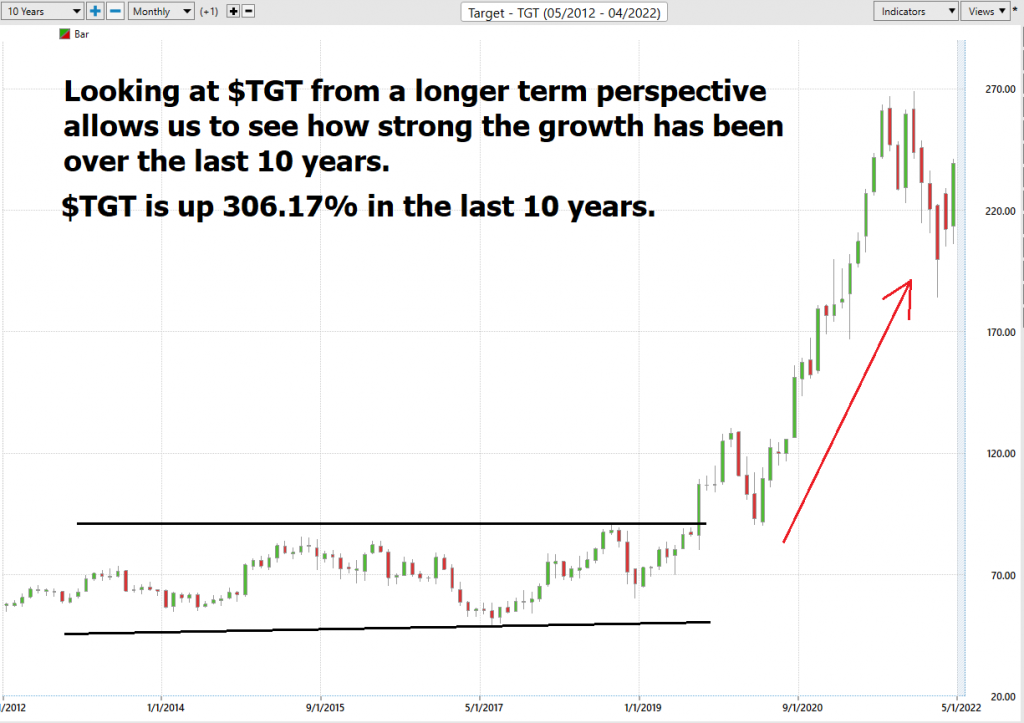
Looking at $TGT from a longer-term ten-year perspective allows us to quickly see how much growth has occurred.
Best Case – Worst Case Scenarios
When we study the long term 52-week chart we can look at the best case and worst-case scenarios just to get an eyeball perspective of the risk and volatility of this asset. This is worth doing anytime you invest or trade to monetarily understand what the potential risks and rewards have been over the past year.
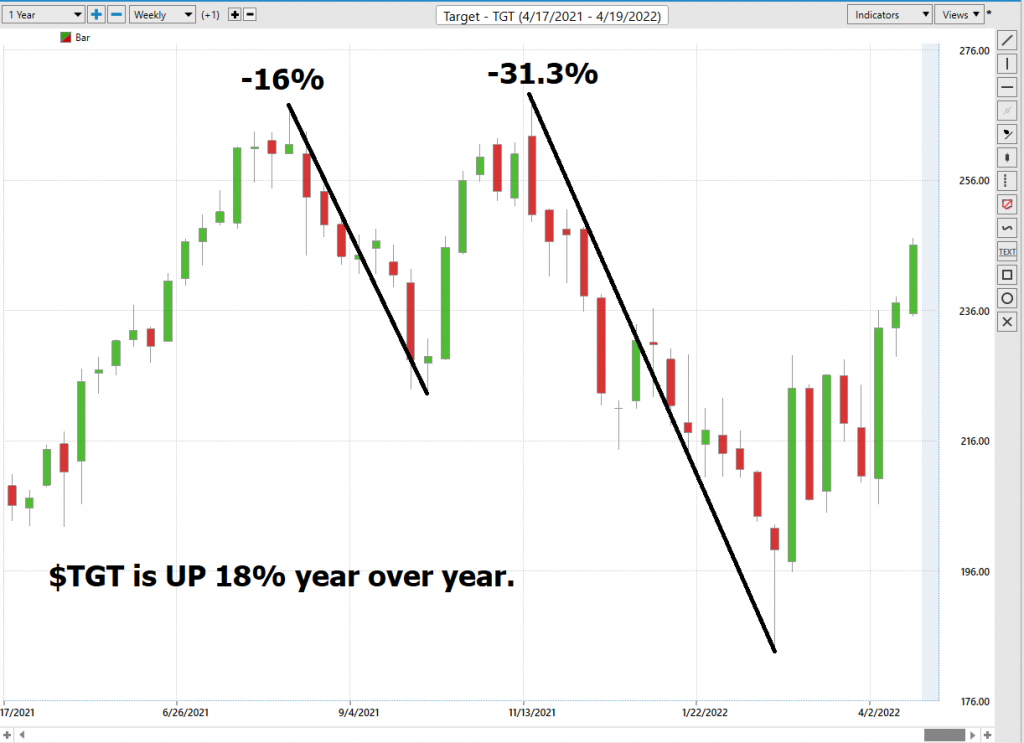
This simple analysis shows us something very practical. In the previous section we stated that the annualized volatility of $TGT was 34.5%. Here on this graphic, we can see that the $TGT had a drawdown of 31.3% over the past year. This drawdown was very much in line with volatility expectations.
Paying attention to the annualized volatility is a simple and effective means of assessing drawdowns in an asset. More importantly, this is also true moving forward. Long term investors should be forewarned that large up moves and drawdowns are very realistic when a stock has an annualized volatility of 34.5%.
Next, we compare $TGT to the broader stock market indexes and to its largest competitors to get an idea of its relative performance.
$TGT + 18%
Walmart +16.8%
Costco +59.8%
S&P 500 Index +7.9%
Dow Jones Industrials +3.22%
NASDAQ +13%
Russell 1000 Index +5.76%
So, in $TGT we have an asset that outperformed the broader stock market indexes, lagged behind its largest competitor (COSTCO) but has also had significant volatility.
The Vantagepoint A.I. Analysis
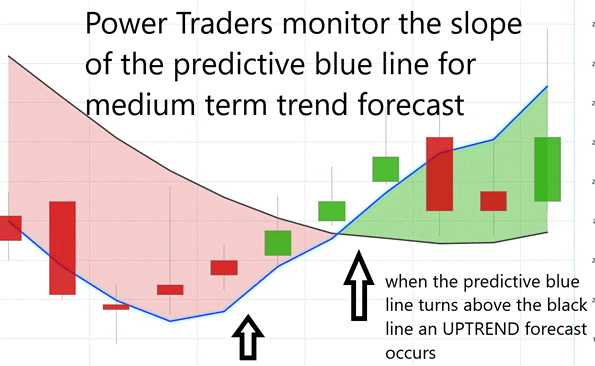
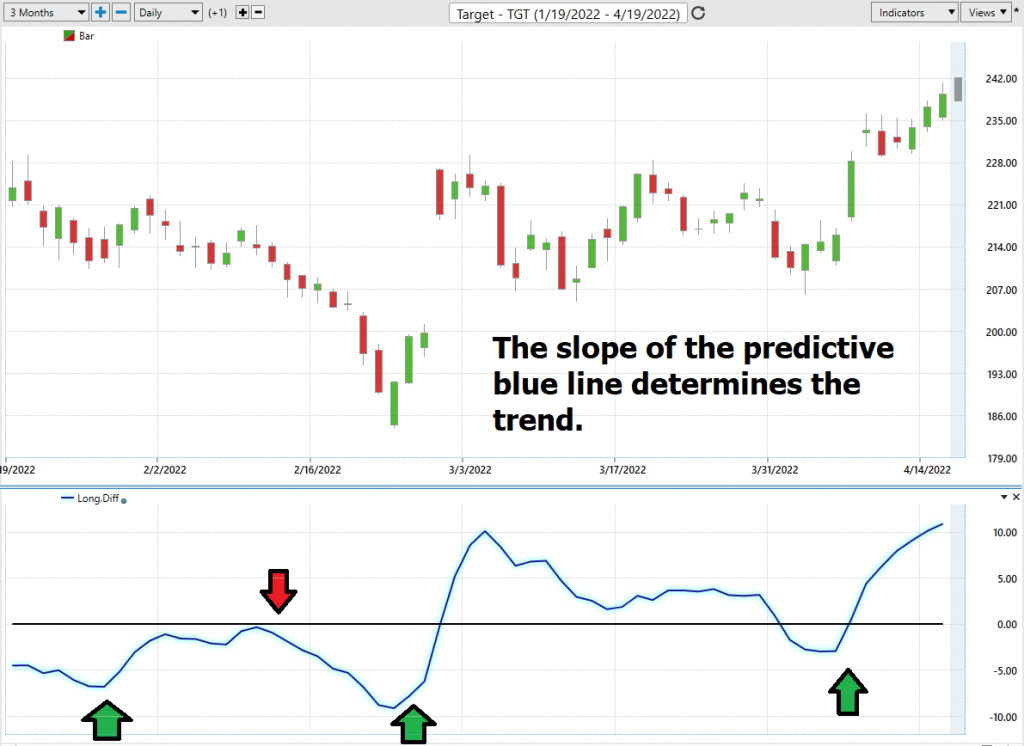
Using VantagePoint Software and the artificial intelligence, traders are alerted to trend forecasts by monitoring the slope of the predictive blue line. The black line is a simple 10 day moving average of price which simply tells you what has occurred in the market. The predictive blue line also acts as value zone where in uptrends traders try to purchase the asset at or below the blue line.
We will zoom in on a smaller period of the last two months.
In studying the chart below pay close attention to the slope of the blue line.
Power Traders pay close attention to the relationship between the black line and predictive blue line. The black line is just a simple 10 day moving average. It Is calculated by taking the closing prices of the last 10 days and dividing that sum by 10. All the black line tells you is what has occurred. It tells you where prices have been and what the average price over the last ten days is.
The predictive blue line, on the other hand, utilizes that Vantagepoint patented Neural Network and Intermarket Analysis to arrive at its value. It looks at the strongest price drivers of an asset through artificial intelligence and statistical correlations to determine its value.
Within the Vantagepoint software we can isolate the the predictive blue line just for the sake of clarity.
Power traders use the predictive blue line in helping to determine both the value zone as well as the trend direction.
When the SLOPE of the predictive blue line turns higher it become clear that a change in price direction is upon us.
Observe how the SLOPE of the predictive blue line started moving higher a few days before its moving above the black line. A strong trend was evidenced by seeing that price was consistently closing above the predictive blue line.
Fine Tuning Entries with The Neural Net Indicator
At the bottom of the chart is the Neural Network Indicator which predicts future strength and/or weakness in the market. When the Neural Net Indicator is green it communicates strength. When the Neural Net is Red it is forecasting short term weakness in the market.
We advocate that Power Traders cross reference the chart with the predictive blue line and neural network indicator to create optimal entry and exit points.
Power Traders are always looking to apply both the neural network and a.i. to the markets to find statistically sound trading opportunities. We refer to this cross refereeing as the Double Confirmation setup.
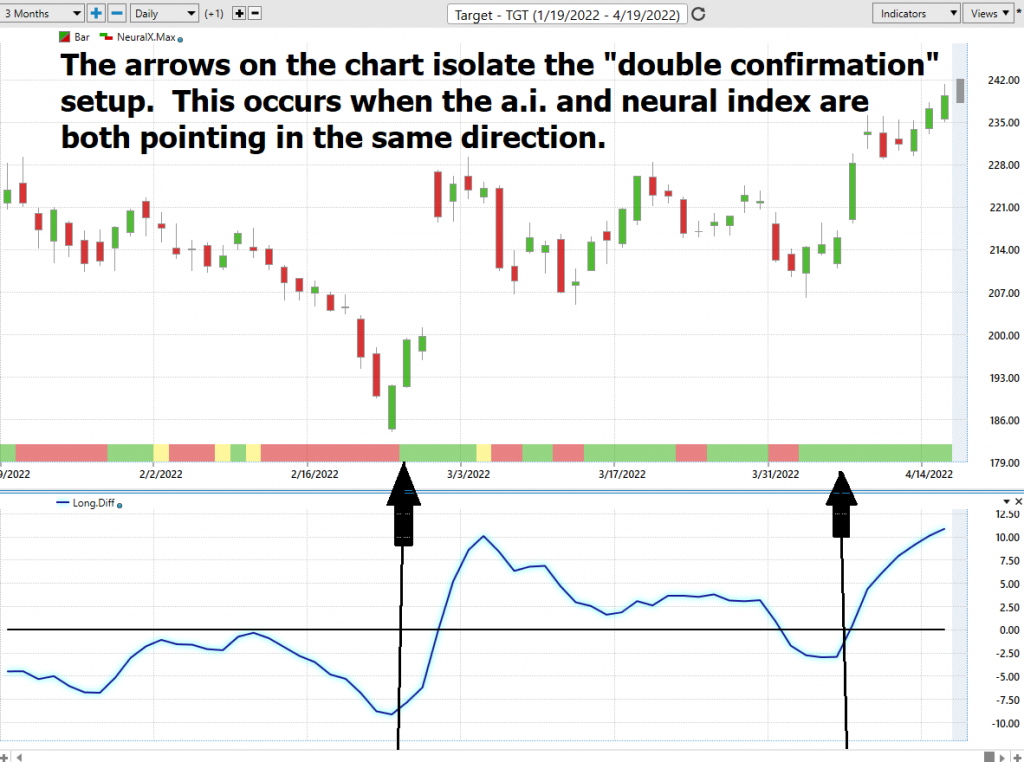
We suggest Power Traders cross-reference the predictive blue line with the Neural Net for the best entry opportunities.
VantagePoint Software Daily Price Range Prediction
One of the powerful features in the Vantagepoint A.I. Software which Power Traders use daily is the Daily Price Range prediction forecast.
This forecast is what permits Power Traders to truly fine tune their entries and exits into the market. Every day traders must decide where to try and buy and sell an asset. The Vantagepoint A.I. Daily Range forecast addresses this issue with exacting precision.
Here is the price chart of $TGT during the most recent runup featuring the Daily Price Range forecast and the Neural Net Indicator.
In summary, whether you are bullish or bearish on the underlying asset you can quickly surmise that the Vantagepoint Daily Price Range forecast is invaluable in helping traders so they can decide where to place their buy and sell stops and determine value in the market.
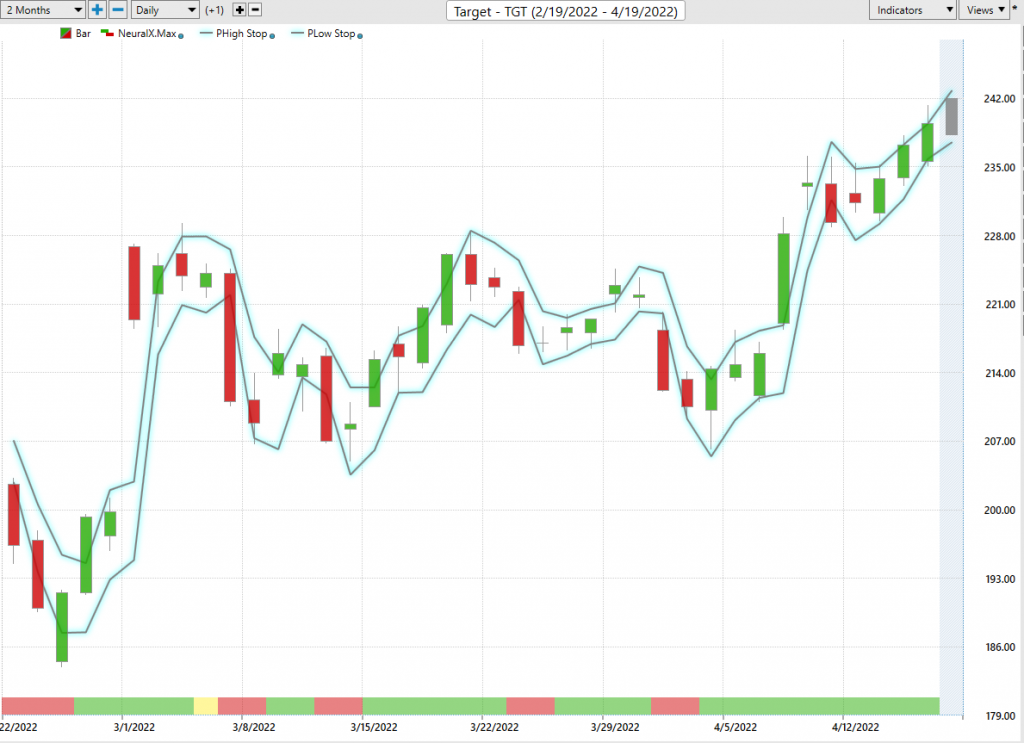
Prices have surged since that forecast and the trend has remained firmly UP. Traders have had numerous opportunities to purchase $TGT towards the lower end of the daily price forecast to fine tune their entries.
Intermarket Analysis
Why is $TGT moving and outperforming most of its competitors?
Ask that question to 100 Wall Street Analysts and you will get 100 different answers.
The challenge for all investors and traders is to differentiate between opinion and fact.
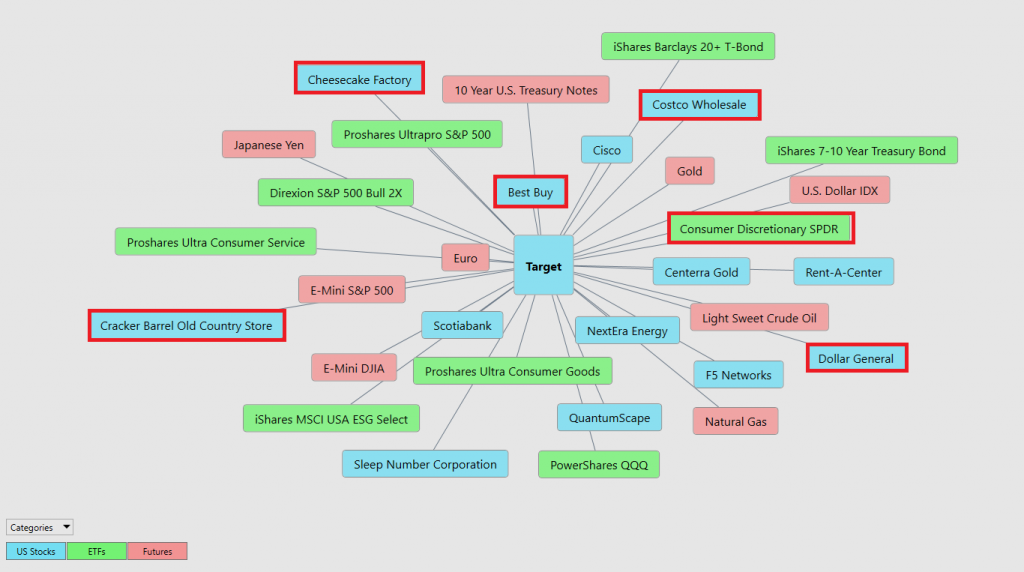
What makes the VantagePoint Software totally unique is its ability to perform Intermarket analysis and to locate those assets which are most interconnected that are responsible for driving the price of $TGT higher or lower.
Studying the charts can always provide objective realities in terms of locating support and resistance levels which become very clear on a chart. But we live in a global marketplace. Everything is interconnected. The billion-dollar question for traders is always what are the key drivers of price for the underlying asset that I am trading?
These intangibles are invisible to the naked eye yet show extremely high statistical correlations.
In $TGT we see an extraordinarily strong and persistent correlation to a handful of other retailers which I have highlighted in red in the following graphic. They are Costco, Best Buy, Cracker Barrel, Cheesecake Factory, and Dollar General.
Slight changes in Interest rates, Crude Oil Prices, and the Volatility of the dollar amongst thousands of other variables affect the decisions companies must make to survive in these incredibly challenging times. Trying to determine what these factors are is one of the huge problems facing investors and traders.
There is excellent value to be had in studying and understanding the key drivers of $TGT price action. Intermarket Analysis allows you to often find opportunities in identical or related sectors who are navigating the financial landscape similarly.
Our Suggestion
The consensus of analysts’ opinions shows that $TGT is still slightly undervalued at current levels.
A sizable percentage of the population purchases groceries at Target which has worked very diligently to offer same-day deliveries and curbside pickup.
Momentum is strong on this asset.
Analysts on Wall Street will be forced to upgrade their estimates and the most optimistic analysts will do so very aggressively based upon the recent quarter’s results which will be released on May 17, 2022.
$TGT is faring very well in the retail space. However, the volatility in this asset is also significantly greater than the broader market indexes.
We expect that pullbacks into the $235 area will be greeted with many buyers who are looking to purchase $TGT at slightly lower prices.
Longer-term may be bullish on $TGT. Its first major resistance is its 52-week high at $268.98.
We advise Power Traders to continue to monitor $TGT and trust VantagePoint’s artificial intelligence.
Let’s Be Careful Out There!
Remember, It’s Not Magic.
It’s Machine Learning.

IMPORTANT NOTICE!
THERE IS SUBSTANTIAL RISK OF LOSS ASSOCIATED WITH TRADING. ONLY RISK CAPITAL SHOULD BE USED TO TRADE. TRADING STOCKS, FUTURES, OPTIONS, FOREX, AND ETFs IS NOT SUITABLE FOR EVERYONE.
DISCLAIMER: STOCKS, FUTURES, OPTIONS, ETFs AND CURRENCY TRADING ALL HAVE LARGE POTENTIAL REWARDS, BUT THEY ALSO HAVE LARGE POTENTIAL RISK. YOU MUST BE AWARE OF THE RISKS AND BE WILLING TO ACCEPT THEM IN ORDER TO INVEST IN THESE MARKETS. DON’T TRADE WITH MONEY YOU CAN’T AFFORD TO LOSE. THIS ARTICLE AND WEBSITE IS NEITHER A SOLICITATION NOR AN OFFER TO BUY/SELL FUTURES, OPTIONS, STOCKS, OR CURRENCIES. NO REPRESENTATION IS BEING MADE THAT ANY ACCOUNT WILL OR IS LIKELY TO ACHIEVE PROFITS OR LOSSES SIMILAR TO THOSE DISCUSSED ON THIS ARTICLE OR WEBSITE. THE PAST PERFORMANCE OF ANY TRADING SYSTEM OR METHODOLOGY IS NOT NECESSARILY INDICATIVE OF FUTURE RESULTS. CFTC RULE 4.41 – HYPOTHETICAL OR SIMULATED PERFORMANCE RESULTS HAVE CERTAIN LIMITATIONS. UNLIKE AN ACTUAL PERFORMANCE RECORD, SIMULATED RESULTS DO NOT REPRESENT ACTUAL TRADING. ALSO, SINCE THE TRADES HAVE NOT BEEN EXECUTED, THE RESULTS MAY HAVE UNDER-OR-OVER COMPENSATED FOR THE IMPACT, IF ANY, OF CERTAIN MARKET FACTORS, SUCH AS LACK OF LIQUIDITY. SIMULATED TRADING PROGRAMS IN GENERAL ARE ALSO SUBJECT TO THE FACT THAT THEY ARE DESIGNED WITH THE BENEFIT OF HINDSIGHT. NO REPRESENTATION IS BEING MADE THAT ANY ACCOUNT WILL OR IS LIKELY TO ACHIEVE PROFIT OR LOSSES SIMILAR TO THOSE SHOWN.

