
United Therapeutics ($UTHR) is a publicly traded biotechnology company based in Maryland, United States. It was founded in 1996 by Martine Rothblatt and Armistead Maupin after the couple lost their daughter to pulmonary arterial hypertension (PAH). The company specializes in the development of innovative medications for treating PAH, with a current focus on synthesizing small molecules, proteins, and antibody/Fc-fusions as therapy options. In addition to developing products, United Therapeutics also studies genomic data to identify pathways and mechanisms related to the disease. They have approximately 1,000 employees worldwide and maintain multiple research and manufacturing facilities across North America and Europe. The company’s main competitors are Mallinckrodt Pharmaceuticals, GlaxoSmithKline plc and Cytokinetics Incorporated, Gilead Sciences, Vertex Pharmaceuticals, Amgen, Regeneron Pharmaceuticals, and AbbVie. Despite stiff competition from other PAH treatments, they maintain a strong presence in the market due to their commitment to researching new therapies as well as an extensive understanding of genomics that helps give them a competitive edge. With an impressive portfolio of products on offer in both the United States and Europe, United Therapeutics looks set to remain at the forefront of PAH treatments for years to come. has been successful in producing treatments for conditions such as pulmonary arterial hypertension (PAH), metastatic melanoma/renal cell carcinoma, chronic graft-versus-host disease (cGVHD), atopic dermatitis (eczema), and age-related macular degeneration (AMD). Through numerous cutting-edge research initiatives, United Therapeutics continues to strive for medical breakthroughs in order to provide new hope for individuals facing serious or fatal illnesses. This commitment makes them a leader among peers in the Biotech field.
United Therapeutics also is the first publicly traded biotech or pharmaceutical company to take the form of a public benefit corporation. A public benefit corporation (PBC) is a type of for-profit entity that incorporates charitable, social, or environmental goals into its operations. Like traditional corporations, a PBC must meet certain legal requirements and is subject to corporate taxation. However, unlike standard corporations, PBCs are required to keep the public interest in mind when making decisions. By cultivating a culture of transparency and accountability, PBCs strive to provide substantial benefits to the public while still making profits. PBCs are also able to raise capital either through private investments or government grants, allowing them to further their social objectives more easily than non-profits. Another unique characteristic of PBCs is that they can pursue additional goals which focus on changing the lives of vulnerable groups within society – things that are not usually associated with traditional for-profit organizations. Overall, public benefit corporations are a valuable tool for businesses who want both to make a meaningful impact on society and turn a profit. These businesses have the potential to revolutionize how companies create value in our ever-changing world. By taking an innovative approach towards sustainability and corporate governance, PBCs pave the way for a better future for all of us.
$UTHR earnings are forecasted to grow by 15.5% per year. Earnings have grown by 9.8% per year over the past 5 years.
In this weekly stock study, we will look at and analyze the following indicators and metrics which are our guidelines to dictate our behavior regarding any stock analysis.
- Wall Street Analysts’ Estimates
- 52-week high and low boundaries
- Vantagepoint A.I. Predictive Blue Line
- The Best Case – Worst Case Scenarios
- Neural Network Forecast
- Daily Range Forecast
- Intermarket Analysis
- Our trading suggestion
We don’t base our trading decisions on things like earnings or fundamental cash flow valuations. However, we do look at them to better understand the financial landscape that a company is operating under.
Wall Street Analysts’ Estimates
The very first thing we like to do in our analysis is to take a quick look at what the Wall Street Analysts are thinking about $UTHR.
Based on 9 Wall Street analysts offering 12-month price targets for United Therapeutics in the last 3 months. The average price target is $296.50 with a high forecast of $375.00 and a low forecast of $250.00. The average price target represents a 9.40% change from the last price of $271.03.
This tells us that the brightest minds on Wall Street which watch the stock full time think that $UTHR has analysts believing it is undervalued. This should see higher than normal volatility which is perfect for Power Traders.
52-Week High and Low Boundaries
Next, we want to see where we are trading in relation to the 52-week range.
Understanding the 52-week high and low boundaries is a valuable tool for traders to have in their arsenal when analyzing stock prices. The 52-week refers to the highest and lowest point that a stock has hit over the last twelve months, creating distinct boundaries of performance. Comparing where the stock currently sits compared to its peak and its trough provides insight into overall market momentum and relative strength against similar stocks and the broader market. This trend analysis can be used to make better-informed investment/trading decisions by helping to identify entry and exit points. The concept of tracking this boundary was developed by gurus like John Templeton and Richard Donchian.
By placing specified upper and lower points around a stock’s value, it allows traders to more accurately analyze the trends a particular asset is undergoing. More specifically, understanding how often a stock breaches its respective boundary can be extremely informative; frequent oscillations between the two could indicate an unstable or volatile company that’s rapidly changing in value – providing keen insight into when it may be a good or bad time to trade. Furthermore, keeping track of these boundaries allows not only subsequent trades but signals to buy low/sell high behavior when there are notable shifts in trend towards either direction. As such, thoroughly understanding this powerful tool is essential for retail investors who want to make informed decisions and maximize their returns. So overall, having knowledge about where these 52-week boundaries lie and calculating the movement between them is an invaluable resource for modern day traders.
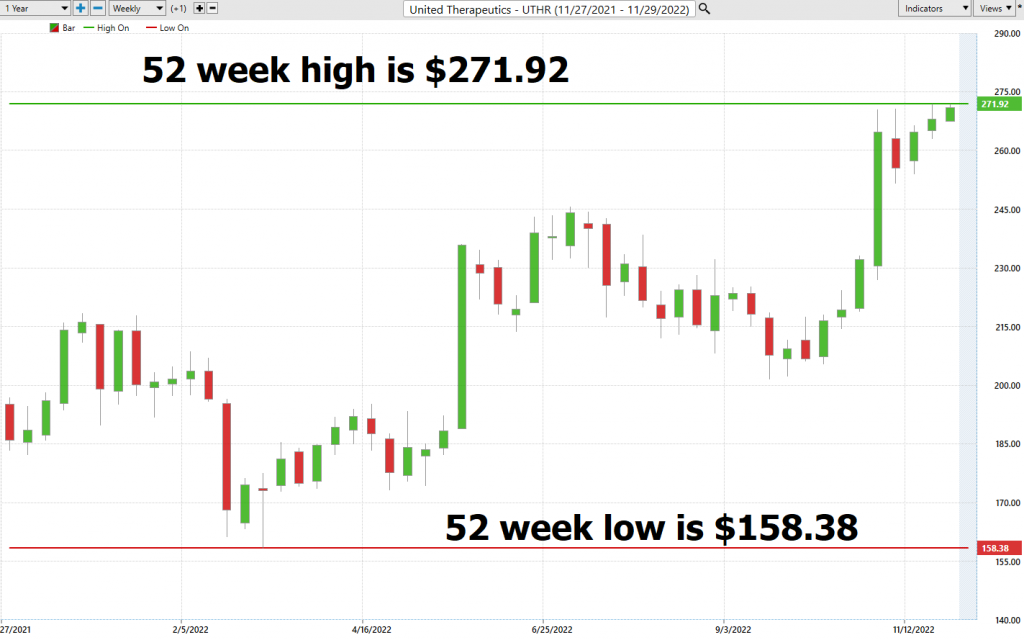
Over the last 52 weeks, $UTHR has traded as high as $271.92 and as low as $158.38. This provides us with an annual trading range of $113.54. When we divide this metric by 52 weeks, we can determine that the average weekly trading range for $UTHR is $2.18. It is currently trading up against its 52-week high with its most recent close at $271.03.
What we often like to do as well is to divide the annual trading range ($113.54) by the current price ($271.03) to provide us with a very basic and generic calculation of how the annualized volatility for $UTHR, which is currently 41.9%.
What this number tells us is that we can define NORMAL during the next year if $UTHR shares trade 41.9% higher or lower. This metric is very important because it will often confine rallies and declines to a level within this metric.
We always advise traders to pay attention to the 52-week high boundary and to view it in relation to what is happening in the broader market. The 52-week high when breached successfully is usually a launchpad for higher prices. However, this boundary is also a stall zone for rallies.
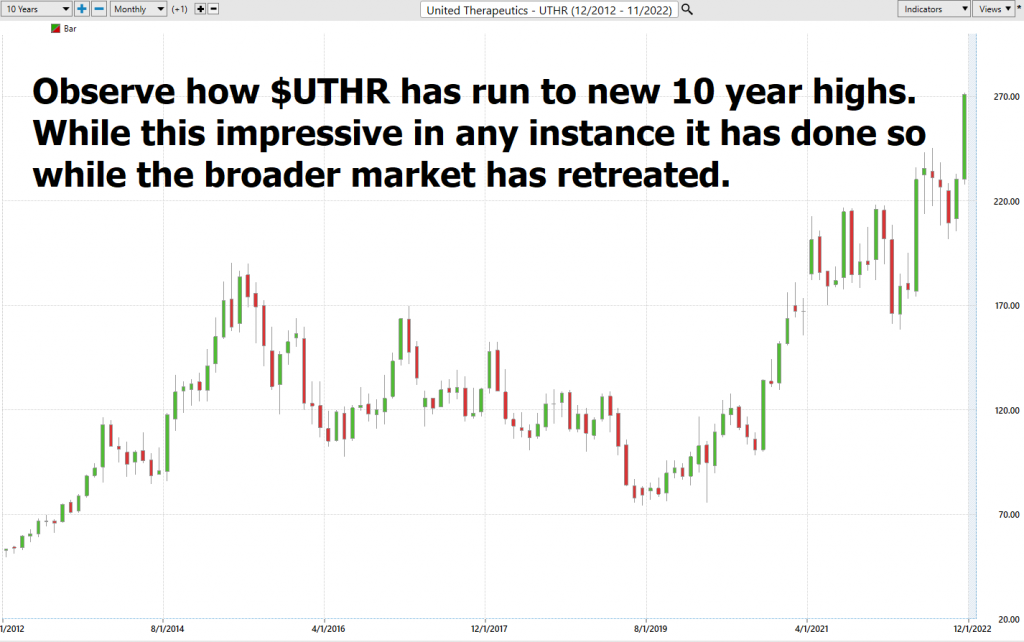
Our experience has been that when a company successfully breaches a 10-year high and 1 year high you should pay attention and place this candidate on your radar. These instances are rare and are indicative of a company that is consistently growing.
$UTHR clearly is in this category as highlighted by the following two charts.
Here is the 10-Year Chart on $UTHR.
Best Case – Worst Case Scenario
Over the last 10 years $UTHR shares are up 407%.
Over the last 52 weeks $UTHR shares are up 44.66%
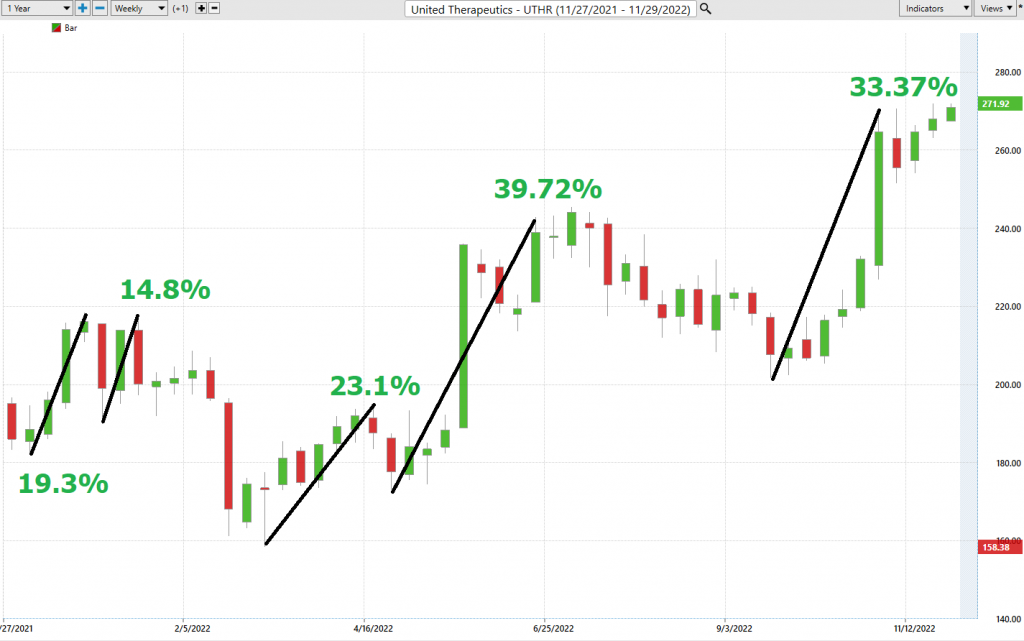
When we study the long term 52-week chart we can look at the best case and worst-case scenarios just to get an eyeball perspective of the risk and volatility of this asset. This is worth doing anytime you invest or trade to monetarily understand what the potential risks and rewards have been over the past decade
Here is a snapshot of the best rallies and worst drawdowns that $UTHR has experienced over the past year measured on a percentage basis.
Followed by the worst-case analysis:
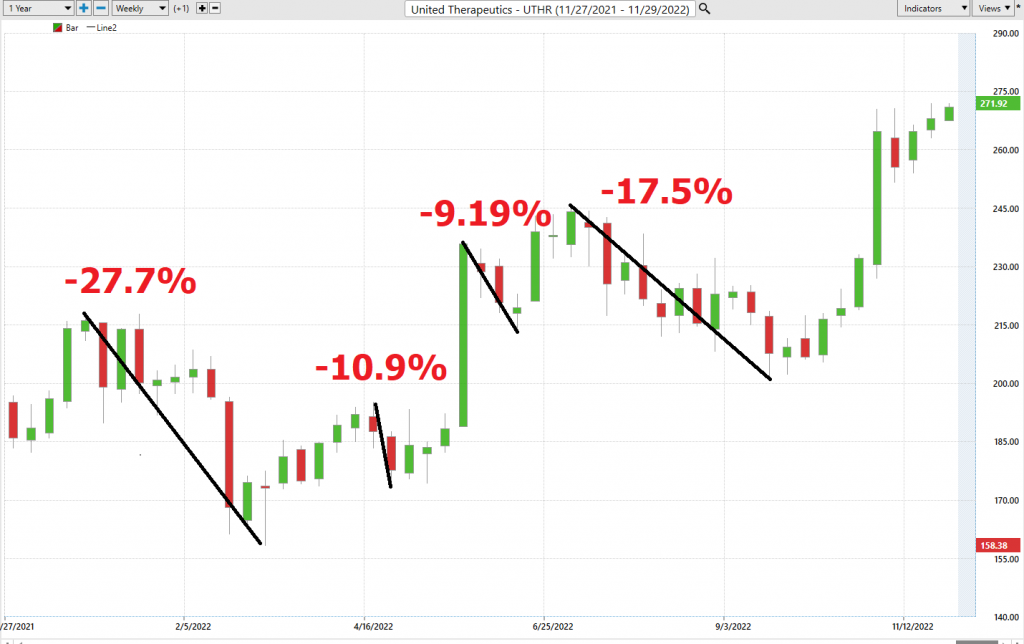
It’s worth doing this type of baseline analysis because it allows you to quickly compare the performance of $UTHR and to understand its risk and reward possibilities. Traders compare the magnitude and quantity of the rallies to the declines. Also, observe how all price action stayed within the boundary of the 41.9% projected statistical volatility.
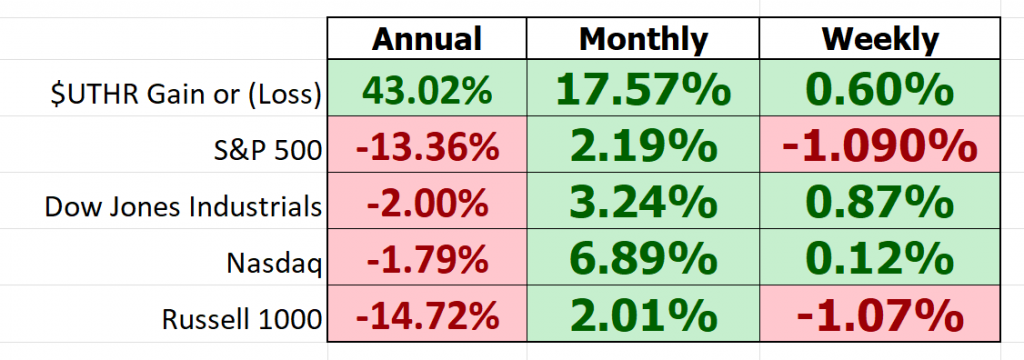
Next, we compare $UTHR to the major broad market indexes. Over the past year.

So, in $UTHR have an asset which has outperformed the broader stock market indexes.
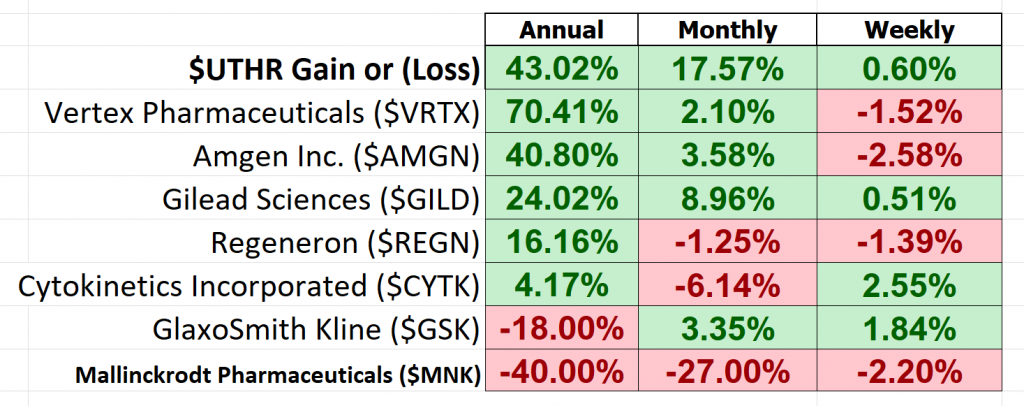
Next, we compare $UTHR to its industry-specific competitors to determine how it has done relative to its competition.

Measured by any comparative performance metric, $UTHR has been a solid and stellar performer. Based upon all of our analysis so far, we would place it firmly on your trading radar as stocks like this will offer numerous trading opportunities in the coming year.
Vantagepoint A.I. Forecast (Predictive Blue Line)
On the following chart you will see the power of the VantagePoint Predictive blue line which determines the medium term trend price forecast.
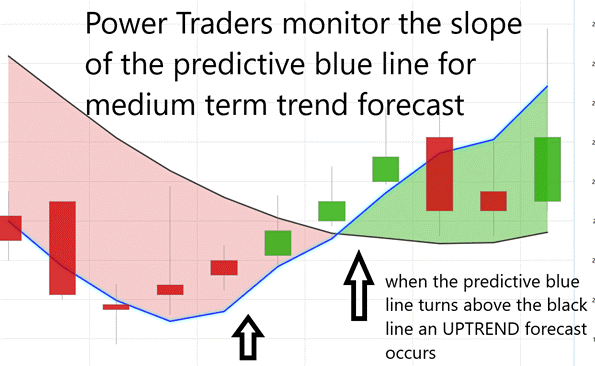
Using VantagePoint Software and the artificial intelligence, traders are alerted to trend forecasts by monitoring the slope of the predictive blue line. The black line is a simple 10 day moving average of price which simply tells you what has occurred in the market. The predictive blue line also acts as value zone where in uptrends traders try to purchase the asset at or below the blue line.
In studying the chart below pay close attention to the slope of the blue line.
Power Traders pay close attention to the relationship between where price closes in relation to the slope of the predictive blue line.
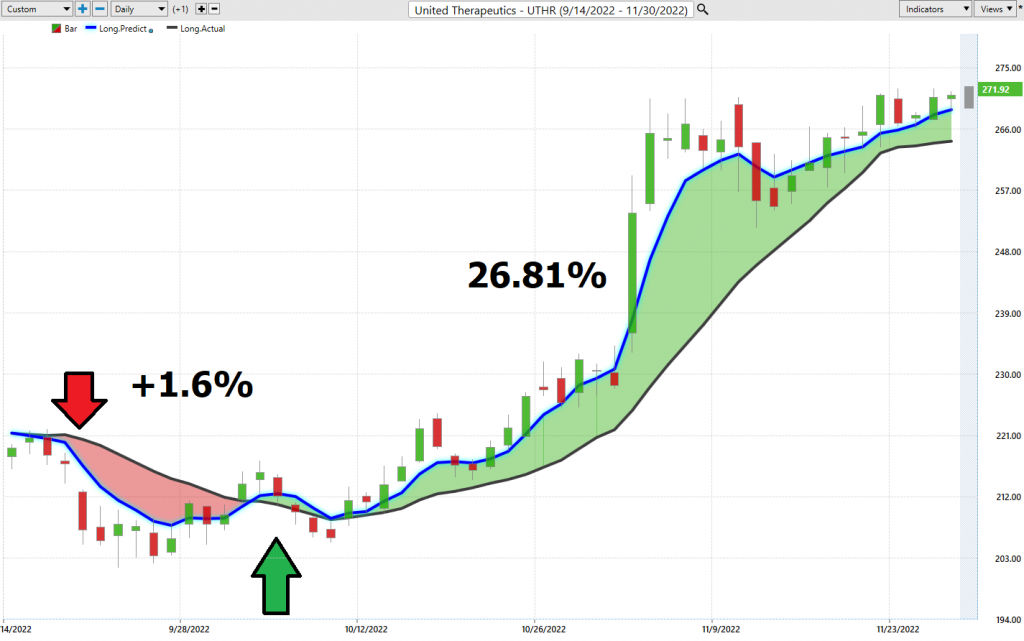
Power traders use the predictive blue line to help to determine both the value zone as well as the trend direction. In other words, in an uptrend traders try to buy the asset at or below the predictive blue line.
Fine Tuning Entries with The Neural Net Indicator
At the bottom of the chart is the Neural Network Indicator which predicts future strength and/or weakness in the market. When the Neural Net Indicator is green it communicates strength. When the Neural Net is Red it is forecasting short term weakness in the market.
A Neural Net is a computational learning system that uses a network of functions to understand and translate massive amounts of data into a desired output, consistently monitoring itself and improving its performance.
Neural networks are computer algorithms which are used for trading financial markets. More specifically, these networks of connected links between computers can identify historical data trends on asset prices in order to make decisions about what a market will do next. Artificial neural networks are founded upon the concept of neurons and memory, similar to how a human brain would function, making their decisions based on observations instead of predefined instructions. Neural networks can have multiple levels of abstraction or complexity depending on the tasks they have been designed to solve, with some being very simplistic while others may be able to use massive datasets to develop sophisticated models. They are valuable because they enable traders to adapt to changing market conditions and help give them an edge over other players by making more informed decisions. The concept of using Artificial Neural Networks was initially developed in the 1950s at Cornell Aeronautical Laboratory, as well as Carnegie Mellon University, though it wasn’t until decades later that modern implementations of Artificial Neural Networks became available for practical use in trading markets. Today successful traders and investors use the Vantagepoint A.I. neural networks for predictive analytics when investing in stocks thanks to their formidable computing power. Therefore, understanding how neural networks can help is becoming increasingly important for those looking to generate profits from trading stocks and bonds. Today, large investment banks such as Goldman Sachs and JPMorgan Chase rely heavily on neural networks to make investment decisions in trading across global markets. Therefore, it’s safe to say that these groundbreaking structures will continue to shape the world of finance for years to come.
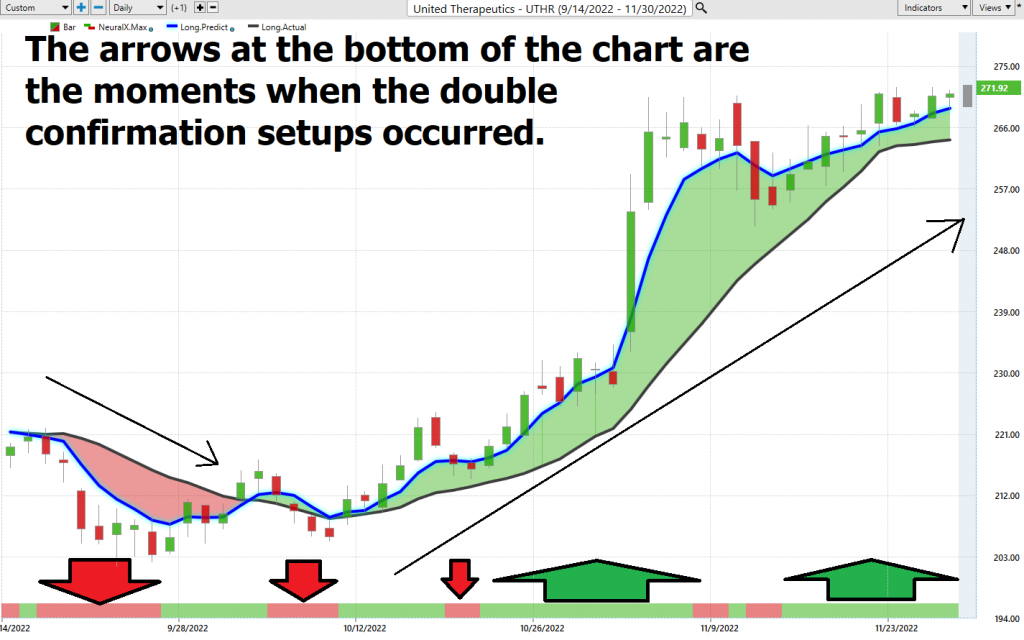
Whenever Power Traders are looking for statistically valid trading setups, they look for a DOUBLE confirmation signal. This signal occurs whenever the blue predictive line and the Neural Net at the bottom of the chart suggest the same future expected outcome.
Neural networks can be constructed using artificial intelligence (AI) and machine learning algorithms. This makes them especially valuable for predicting future stock prices, detecting fraud or anomalies in analytical processes, determining correlations among different economic trends, and understanding large amounts of financial data quickly and efficiently.
We advocate that Power Traders cross reference the chart with the predictive blue line and neural network indicator to create optimal entry and exit points.
Power Traders are always looking to apply both the neural network and a.i. to the markets to find statistically sound trading opportunities.
VantagePoint Software Daily Price Range Prediction
The purpose of all these indicators so far is to help traders stay on the right side of the right trend at the right time.
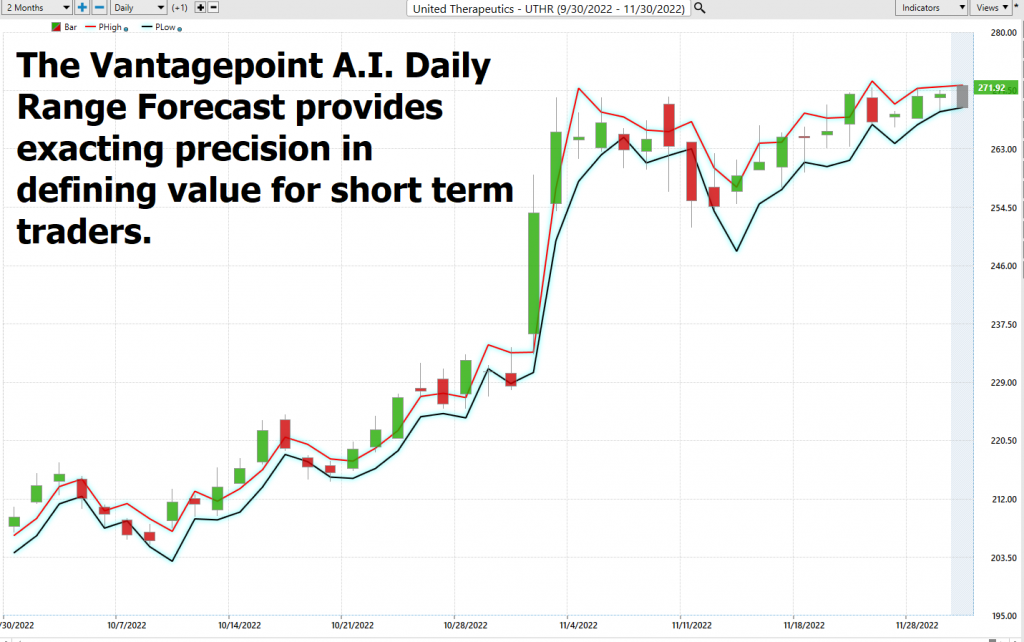
One of the powerful features in the Vantagepoint A.I. Software which Power Traders use daily is the Daily Price Range prediction forecast.
This forecast is what permits Power Traders to truly fine tune their entries and exits into the market, often looking for smaller time frames and more granular trading opportunities.
Over the past year this following graphic shows what the average trading range has been on a daily, weekly and monthly basis.
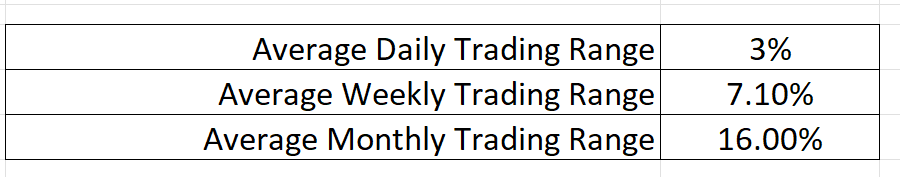
The challenge is that traders always need to be able to define value and determine where they should get in and out of a trade. The Vantagepoint A.I. Daily Range forecast provides this information with precision.
Using a.i., machine learning, and neural networks are daily range forecast is created by the software for each trading session. This assist traders in deciding how to stay on the right side of the right trend at the right time.
Intermarket Analysis
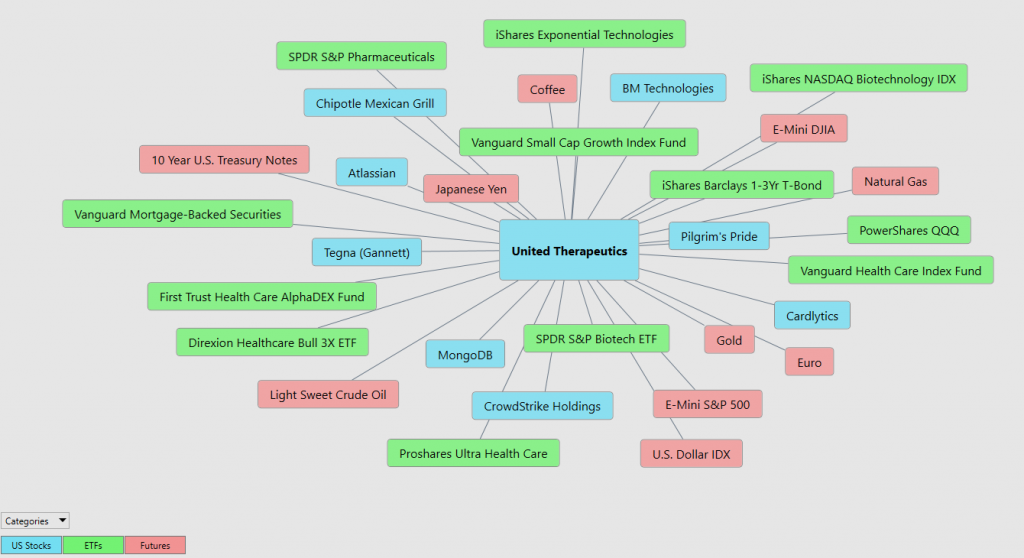
What makes the Vantagepoint Software truly unique is its ability to perform Intermarket analysis and to locate those assets which are most interconnected that are responsible for driving the price of $UTHR higher or lower.
Studying the charts can always provide objective realities in terms of locating support and resistance levels which become very clear on a chart. But we live in a global marketplace. Everything is interconnected. The billion-dollar question for traders is always what are the key drivers of price for the underlying asset that I am trading?
These intangibles are invisible to the naked eye yet show extremely high statistical correlations.
The concept of intermarket analysis was first introduced by renowned economists like Jacob Frenkel, Alfred Chandler, and Robert Shiller who believed that the interaction among different markets could impact aggregate economic performance. In financial trading this type of research was pioneered by Vantagepoint A.I. founder, Lou Mendelsohn.
For example, when one market experiences a downturn, it can affect other markets such as commodities, bonds, stocks, and currencies as well. By understanding such correlations, traders can better anticipate market moves and formulate effective trading strategies accordingly. Primarily used by professional investors and institutions, intermarket analysis helps them evaluate asset prices within multiple market sectors in order to obtain lucrative profit opportunities while managing risks associated with portfolio composition. With increasingly sophisticated data gathering technologies enabling comprehensive intermarket studies, more individual investors are utilizing this approach to manage their investments effectively.
Its main benefit is that it helps traders gain insights into how certain markets are interconnected and dependent on one another across different asset classes and various geographic locations. By combining technical analysis methods with intermarket analyses, traders can more accurately make informed decisions when trading in any given market. Intermarket analysis increases their arsenal of tools by allowing them to assess other markets which may be affected due to changes in the global economy, understanding relationships between markets they may not ordinarily focus on at first glance. By focusing on various factors that traditionally influence market prices, traders can use intermarket analyses to form more educated opinions about future trends and act accordingly with confidence.
Slight changes in Interest rates, Crude Oil Prices, and the Volatility of the dollar amongst thousands of other variables affect the decisions companies must make to survive in these incredibly challenging times. Trying to determine what these factors are is one of the huge problems facing investors and traders.
There is immense value to be had in studying and understanding the key drivers of $UTHR price action.
By doing so you can often see which ETFs are most likely acquiring $UTHR as well as uncovering other industries, commodities, forex which affect $UTHR price movement.
Here is a graphic worthy of your further study. It displays the top 31 drivers of $UTHR’s price action.
Suggestion for Traders
United Therapeutics provides a unique trading opportunity for investors. As a pharma and biotech company, their product offering is not affected by societal trends the way other companies may be. The products they offer are in high demand, so they represent a consistently strong performer. Furthermore, United Therapeutics often leads and innovates in the industry, which can give their stock price a boost if one of their initiatives succeeds or experiences widespread adoption. The company often has plenty of opportunities to expand to new markets, giving them potential for significant growth soon as well. In addition, many of their products provide steady long-term value over time as well as short-term profits from initial releases or breakthroughs on an individual project level.
United Therapeutics has consistently delivered good returns to its investors, and it continues to launch innovative treatments for a range of conditions. We expect that it will encounter some additional volatility at its current 52-week high.
However, based upon its relative performance to the broader stock market as well as its industry this is a company you should put firmly on your radar and monitor closely. We think it will offer great trading opportunities moving forward.
The trend is UP. Volatility is high.
We will use the Vantagepoint A.I. daily range forecast to guide our trading decisions moving forward.
We urge all traders to practice good money management and allow the artificial intelligence to guide your decision-making process.
As mentioned earlier in this analysis, whenever a stock makes 10-year highs you need to place it on your radar as it is communicating to the world that it is growing and overcoming all obstacles related to its business model.
Pay attention to $UTHR.
Let’s Be Careful Out There!
Remember, It’s Not Magic.
It’s Machine Learning.

IMPORTANT NOTICE!
THERE IS SUBSTANTIAL RISK OF LOSS ASSOCIATED WITH TRADING. ONLY RISK CAPITAL SHOULD BE USED TO TRADE. TRADING STOCKS, FUTURES, OPTIONS, FOREX, AND ETFs IS NOT SUITABLE FOR EVERYONE.
DISCLAIMER: STOCKS, FUTURES, OPTIONS, ETFs AND CURRENCY TRADING ALL HAVE LARGE POTENTIAL REWARDS, BUT THEY ALSO HAVE LARGE POTENTIAL RISK. YOU MUST BE AWARE OF THE RISKS AND BE WILLING TO ACCEPT THEM IN ORDER TO INVEST IN THESE MARKETS. DON’T TRADE WITH MONEY YOU CAN’T AFFORD TO LOSE. THIS ARTICLE AND WEBSITE IS NEITHER A SOLICITATION NOR AN OFFER TO BUY/SELL FUTURES, OPTIONS, STOCKS, OR CURRENCIES. NO REPRESENTATION IS BEING MADE THAT ANY ACCOUNT WILL OR IS LIKELY TO ACHIEVE PROFITS OR LOSSES SIMILAR TO THOSE DISCUSSED ON THIS ARTICLE OR WEBSITE. THE PAST PERFORMANCE OF ANY TRADING SYSTEM OR METHODOLOGY IS NOT NECESSARILY INDICATIVE OF FUTURE RESULTS. CFTC RULE 4.41 – HYPOTHETICAL OR SIMULATED PERFORMANCE RESULTS HAVE CERTAIN LIMITATIONS. UNLIKE AN ACTUAL PERFORMANCE RECORD, SIMULATED RESULTS DO NOT REPRESENT ACTUAL TRADING. ALSO, SINCE THE TRADES HAVE NOT BEEN EXECUTED, THE RESULTS MAY HAVE UNDER-OR-OVER COMPENSATED FOR THE IMPACT, IF ANY, OF CERTAIN MARKET FACTORS, SUCH AS LACK OF LIQUIDITY. SIMULATED TRADING PROGRAMS IN GENERAL ARE ALSO SUBJECT TO THE FACT THAT THEY ARE DESIGNED WITH THE BENEFIT OF HINDSIGHT. NO REPRESENTATION IS BEING MADE THAT ANY ACCOUNT WILL OR IS LIKELY TO ACHIEVE PROFIT OR LOSSES SIMILAR TO THOSE SHOWN.

