
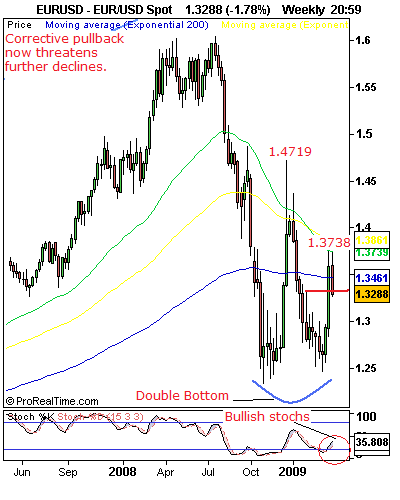
Collapses Through The 1.3330 Level.
EURUSD– EUR’s corrective pullbacks following its recent sharp rally witnessed a price collapse below its key support at the 1.3330 level, its Jan 27’09 high/range top the past week. This price development leaves its short term recovery off the 1.2456 level, its Mar 04’09 high on hold and has opened up downside threats towards the 1.3093 level, its Feb 09’09 high and subsequently the 1.2992/1.3000 area, its Feb 23’09 high/psycho level. Maintaining above the former or even the latter is now required to create some hope of a return back above the 1.3330 level which is now seen as a resistance and expected to hold on retests. If above the 1.3330 level is printed, we could see a run at its Mar 19’09 high at 1.3738 with a clean break and hold above there highlighting the 1.3799 level, its Jan 08’09 high ahead of a bigger resistance zone at the 1.3857/88 levels,its.618 Ret(1.4719-1.2330 declines)/Sept 11’08 high. Weekly momentum remains positive in structure suggesting further strength. On the whole, while its short term recovery higher remains shaky below the 1.3330 level, we expect the 1.3093 or even the 1.2992/1.3000 area to contain current price declines and push the pair back up again.
Directional Bias:
Nearer Term -Mixed
Short Term -Bullish
Medium Term -Bearish
Performance in %:
Past Week: -2.16%
Past Month: -1.00%
Past Quarter: -1.05%
Year To Date: -4.90%
Weekly Range:
High -1.3736
Low -1.3257
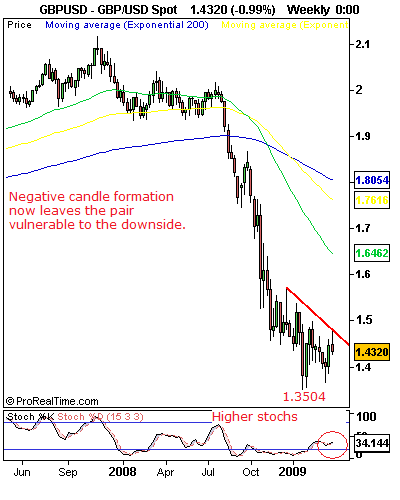
Shooting Star Formation With Downside Implication.
GBPUSD– GBP’s recovery activated at the 1.3655 level, its Mar 11’09 low failed ahead of a key resistance at its Jan 16’09/Feb 09’09 highs at 1.4981/86 and turned lower at the 1.4778 level to close the week at 1.4320.A shooting star candle formation( a top reversal signal) is now in place and a follow through lower towards the 1.4305 level, its Mar 06’09 high at 1.4305 is now envisaged with a break of that level putting the next downside target at the 1.4137 level, its Feb 12’09 low and followed by its Feb 02’09 low at 1.4052.Daily RSI and stochastics are positive and trending lower suggesting further weakness. To the topside, a return above the 1.4662 level, its Feb 23’09 high is now required to reduce its current downside threats and pave the way for a move towards its Jan 16’09/Feb 09’09 highs at 1.4981/86.Beyond there if seen will leave the next upside objective at the 1.5374 level, its Jan 08’09 high. All in all, the current downside weakness is reflective of the pair’s overall medium to longer term bearishness.
Directional Bias:
Nearer Term -Bearish
Short Term -Bearish
Medium Term -Bearish
Performance in %:
Past Week: -1.00%
Past Month: -1.21%
Past Quarter: -17.94%
Year To Date: -2.1%
Weekly Range:
High -1.4778
Low -1.4268
This is an excerpt from FXT Technical Strategist Plus, a 7-currency model analysis. Take A One Week Free Trial at www.fxtechstrategy.com
This report is prepared solely for information and data purposes. Opinions, estimates and projections contained herein are those of FXTechstrategy.com own as of the date hereof and are subject to change without notice. The information and opinions contained herein have been compiled or arrived at from sources believed to be reliable but no representation or warranty, express or implied, is made as to their accuracy or completeness and neither the information nor the forecast shall be taken as a representation for which FXTechstrategy.com incurs any responsibility. FXTstrategy.com does not accept any liability whatsoever for any loss arising from any use of this report or its contents. This report is not construed as an offer to sell or solicitation of any offer to buy any of the currencies referred to in this report.

