
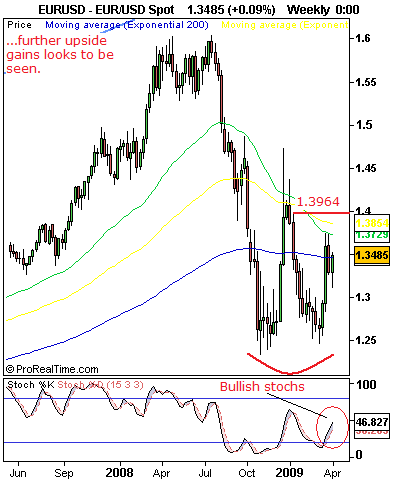
Back Above The 1.3330 Level With Sight On The 1.3738 Region.
EURUSD– As corrective rally has bottomed out at the 1.3113 level and a rally through the 1.3330 level, its Jan 27’09 high/range top occurred the past week, continued recovery higher is now expected to target its Mar 19’09 high at 1.3738.Though another support exist s before this at the 1.3616 level, its daily 200 ema,the former is more significant as a decisive push through there will resume its short term uptrend initiated at the 1.2456 level, its Mar 04’09 high towards the 1.3964 level, representing Jan 05’09 high. Extending through latter will mean a run at its Dec 29’08 high at 1.4363 and ultimately its Dec 18’08 high at 1.4719. The RSI and stochastics are also pointing higher, indicating the current recovery is likely to continue. On any pullbacks from here, its invalidated resistance is now expected to reverse roles and provide support there by turning the pair higher again.Howver,if this fails to occur we could see further declines shaping up towards the 1.3093 level, its Feb 09’09 high and subsequently the 1.2992/1.3000 area, its Feb 23’09 high/psycho level. Overall, our outlook remains for the pair to hold on to its current gains, push further to upside and eventually resume its ST uptrend triggered off the 1,2456 level.
Directional Bias:
Nearer Term -Bullish
Short Term -Bullish
Medium Term -Bearish
Performance in %:
Past Week: +1.48%
Past Month: +4.59%
Past Quarter: -5.10%
Year To Date: -3.49%
Weekly Range:
High -1.3517
Low -1.3113
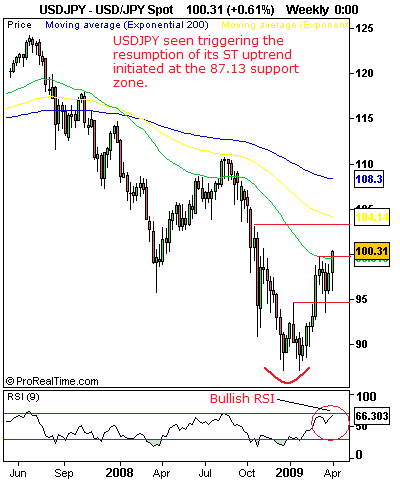
Resumes Short Term Uptrend, Eyes The 100.55 Level and Beyond.
USDJPY– Having decisively eroded the 99.68 level, its Mar 05’09 high and its psycho resistance at 100.00 the past week following its recovery off the 95.96 level, its Mar 30’09, risk has now shifted to the upside for a move towards another key resistance residing at the 100.55 level, its Nov 04’08 high. Breaching that level will put the pair on the path to further upside gains towards the 102.42 level, its Oct 20’08 high followed by the 103.07 level, its Oct 14’08 high. Weekly momentum indicators are pushing higher, adding more to growing bullish evidence. On the other hand, the lost resistance at the 99.68 level, its Mar 05’09 high is now expected to reverse roles and provide support therefore pushing the pair back up again. Other supports below here are located at the 98.87 level, its Mar 26’09 high with a loss of there setting the stage for a move lower towards the 95.96 level, its Mar 30’09 and next the 94.62,its Jan’09 high. On the whole, with the 99.68 level overcome, threats of further upside gains are now seen.
Directional Bias:
Nearer Term -Bullish
Short Term -Bullish
Medium Term -Bearish
Performance in %:
Past Week: +2.49%
Past Month: +1.78%
Past Quarter: +9.53%
Year To Date: +10.16%
Weekly Range:
High -100.37
Low -95.96
This is an excerpt from FXT Technical Strategist Plus, a 7-currency model analysis. Take A One Week Free Trial at www.fxtechstrategy.com
This report is prepared solely for information and data purposes. Opinions, estimates and projections contained herein are those of FXTechstrategy.com own as of the date hereof and are subject to change without notice. The information and opinions contained herein have been compiled or arrived at from sources believed to be reliable but no representation or warranty, express or implied, is made as to their accuracy or completeness and neither the information nor the forecast shall be taken as a representation for which FXTechstrategy.com incurs any responsibility. FXTstrategy.com does not accept any liability whatsoever for any loss arising from any use of this report or its contents. This report is not construed as an offer to sell or solicitation of any offer to buy any of the currencies referred to in this report.

