
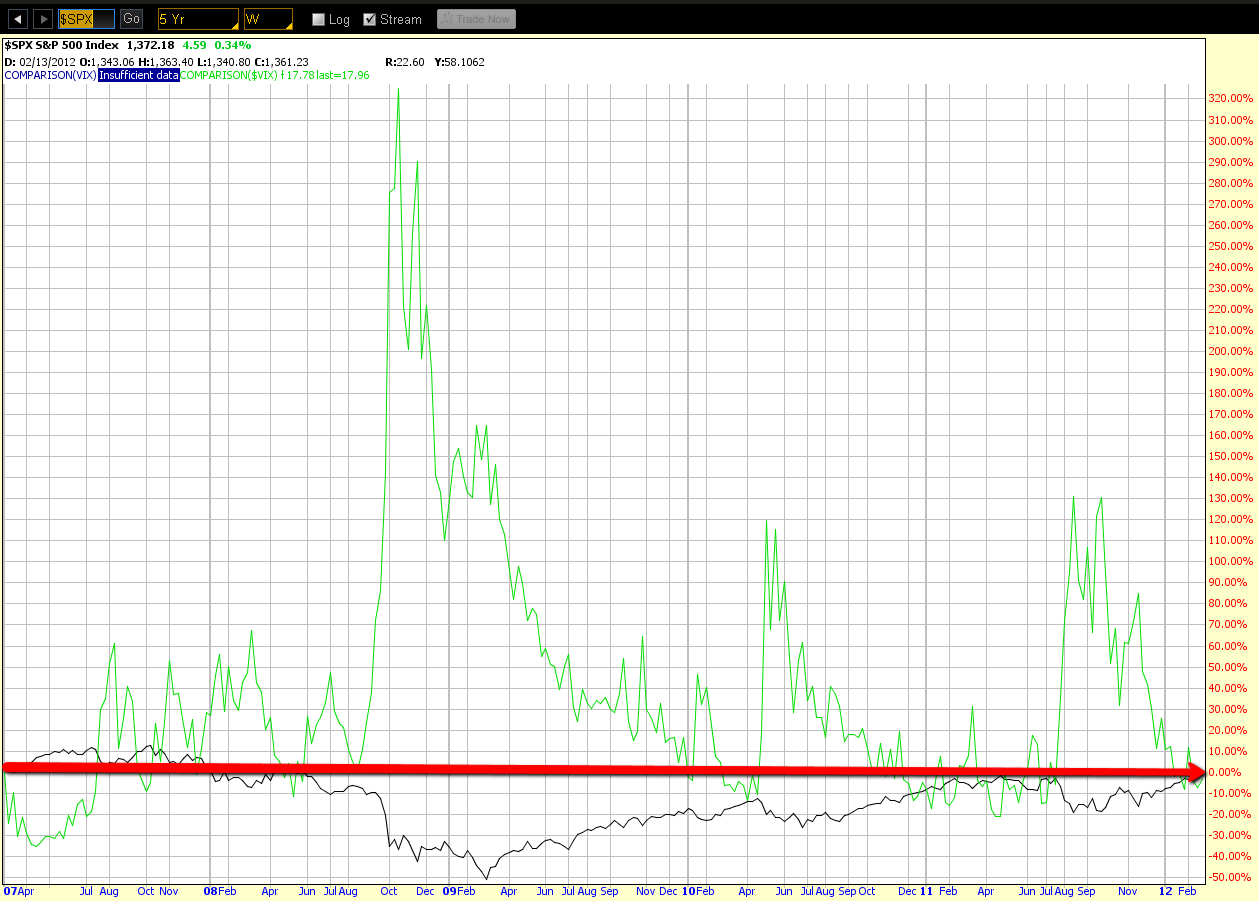
The 5-Year Weekly chart below shows a comparison of the S&P 500 Index to the VIX. We can see what can happen when price has traded around the levels at which they are currently situated. On each of the past four years, price has spiked rather quickly from these levels by large percentages on the VIX, sending the S&P 500 plunging.
T…

