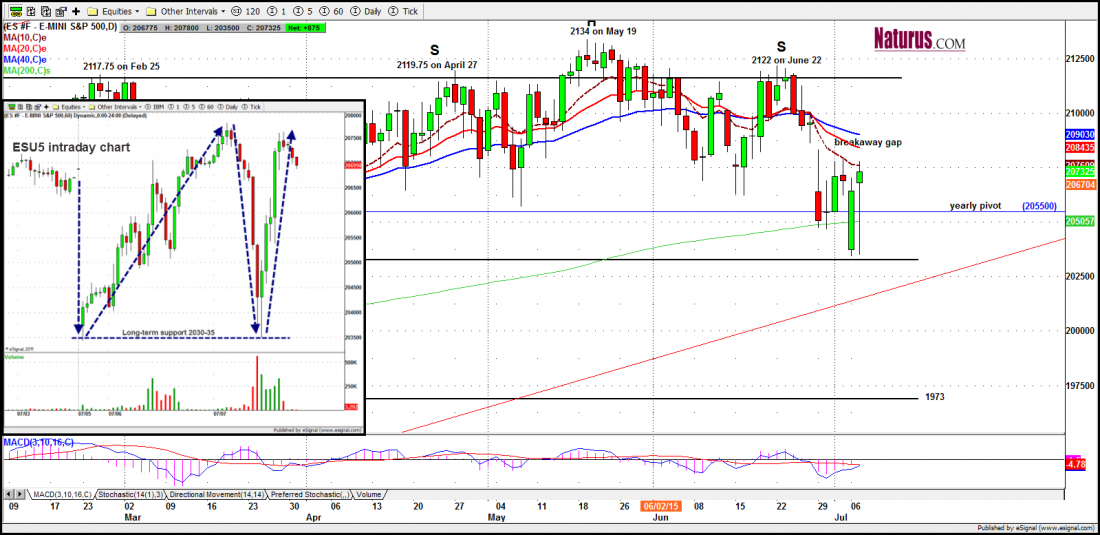
If you want to see a picture of intra-day volatility, take a look at the insert in today’s chart of the S&P 500 mini-futures (ES). The minis trade in global markets almost 24 hours a day, while the underlying cash index is closed after 4:00 p.m. New York time. That means the ES provides a way for traders in Asia and especially Europe to hedge their exposure to US equities even when those equities are not trading.
After the results of the Greek referendum were known Sunday night, European traders sold the futures heavily, and the ES gapped down about 30 points. It traded back up 45 points overnight and during the day session, only to give up the whole gain overnight Monday and early Tuesday, before regaining 40 points in Tuesday’s afternoon trading.
It closed yesterday at 2073.75 for a gain of 9.25 above the previous close, but only 2.25 above the close before the holiday. That’s what the Greek crisis did to US markets: lots of movement, but not much change.
As traders, we love this. The gain for holding the ESU5 over the holiday weekend was 2.25 points. During that time the market moved through about 130 points, and all that movement was available to traders … at $50 per point for each contract. We don’t care which way it goes, as long as it moves.
Today
The price action in the past two days has been bullish, selling on strength and buying on weakness. Today the 2076 level – the 10-day moving average line – will remain a key area. A move above it will be bullish and will trigger buying momentum; the odds will then favor a further upside move toward the 20/40-day moving average line or higher to push up to fill the 2095.75 gap.
If there is no follow-through today and ES stays under the 2076 line, we should expect the ES to drop back toward the pivot area 2055-50 for testing. In any case 2035-34 should be the short-term bottom for at least this week.
Major support levels for Wednesday: 2043-30, 2018-21, 2006-03, 1980-75;
Major resistance levels: 2085-86, 2093.75-95.50, 2105-06, 2112.50-14.50,
To get more actionable analysis of US equity markets from Naturus.com follow this link