
REMEMBER: THIS IS BIG PICTURE ONLY – NOT INTRADAY! Please NOTE!!!! This is an opinion only!
SPECIAL NOTE:
None this week
CLICK ON IMAGES TO ENLARGE
——————————————————————————–
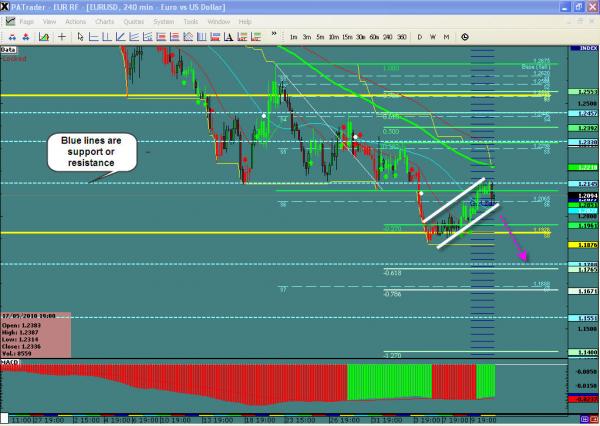
EURUSD
WHAT I SEE: Markets are so skittish due to the Greece bailout that traders are reluctant to put in much money – just my take. On the Day chart we have broke north of the former downtrend but not with any authority. We did fill the Gap so now it is up to the market movers. With Greece being a drain on the Euro it is had to put much stock in an up move but the technical’s say that is what we are doing. If it does not materialize, look for a triple bottom. The up move should go to the 1.3674 Day chart Resistance and then the R6 @ 1.3077. WAIT for confirmation of which way. I am leaning towards bearish but as you can see that is why traders are having a hard time with this market.
——————————————————————————–
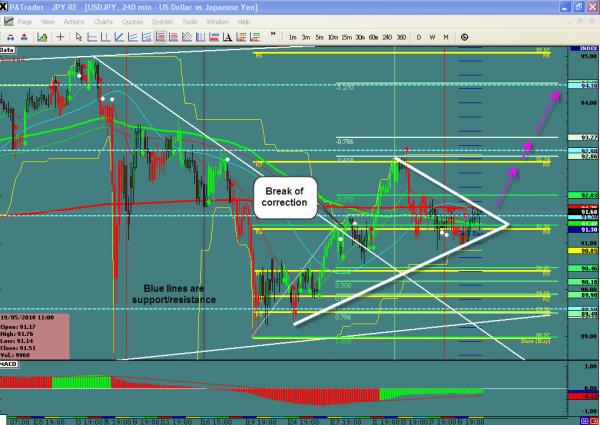
USDJPY
WHAT I SEE: Watch the EURUSD for clues on this one since it usually is an opposite move. Syill making higher highs and lows on the day chart although we came very close to hitting the .786 retracement of the last big down move (08/05-11/25-09). The bounce point on this pullback should be the confluence of the two .500 retracements at 91.44. Bounce would produce a move to the R7 again and then maybe the 0.270 Fibo extension. Break the trendline look for a double bottom.
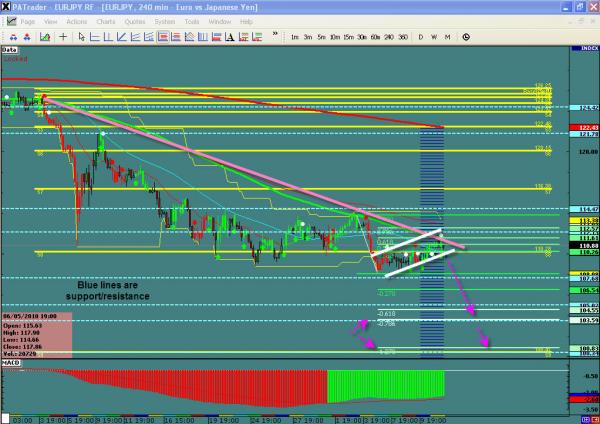
EURJPY – ALWAYS MY PREFERRED TRADE!!!!!
WHAT I SEE: -. Nice bear flag on the EJ on the Day chart leads to credence in the bearish bias. We have taken out the .500 fibo and coming down hard so I like the .270 extension @ 115.09.
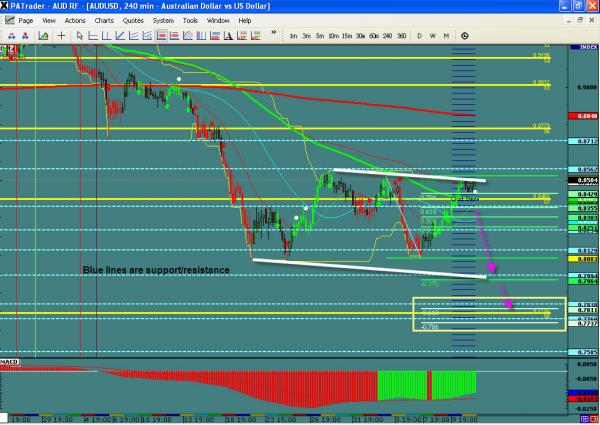
AUDUSD – A great smooth currency for Newbies!
WHAT I SEE: I wrote last week: We have broken the former downtrend off the day chart and now appears that the Carry Trade is in force ( interest rate differential). Pretty easy to see the target areas north.
Still testing this same top! As you can see a big sideways range. A pullback to go again should go to the .500 fib @ .9002. A break north would target the R7 and then the 0.9659 (.270 Fibo extension).
——————————————————————————–
EXTREME CAUTION IS URGED – TRADE WITH STOPS!!!!!
BTW – if you want to save the pics, right click and hit “save as”.
IMPORTANT NOTICE: These comments are for information purposes only. The information contained on this document does not constitute a solicitation to buy or sell by ProAct Traders, LLC., and/or its affiliates, and is not to be available to individuals in a jurisdiction where such availability would be contrary to local regulation or law. Opinions, market data, and recommendations are subject to change at any time. Forex trading involves substantial risk of loss and is not suitable for all investors. We monitor multiple indicators as well as established chart analysis.
There is No “Holy Grail” in trading systems. Do not use our research or any other trading system without proper research on the asset.
This is an opinion ONLY – and not a trade call, but a study that may lead you to a trade. I do not know whether this will transpire or not so use your own judgment.

