
 By: Evan Lazarus
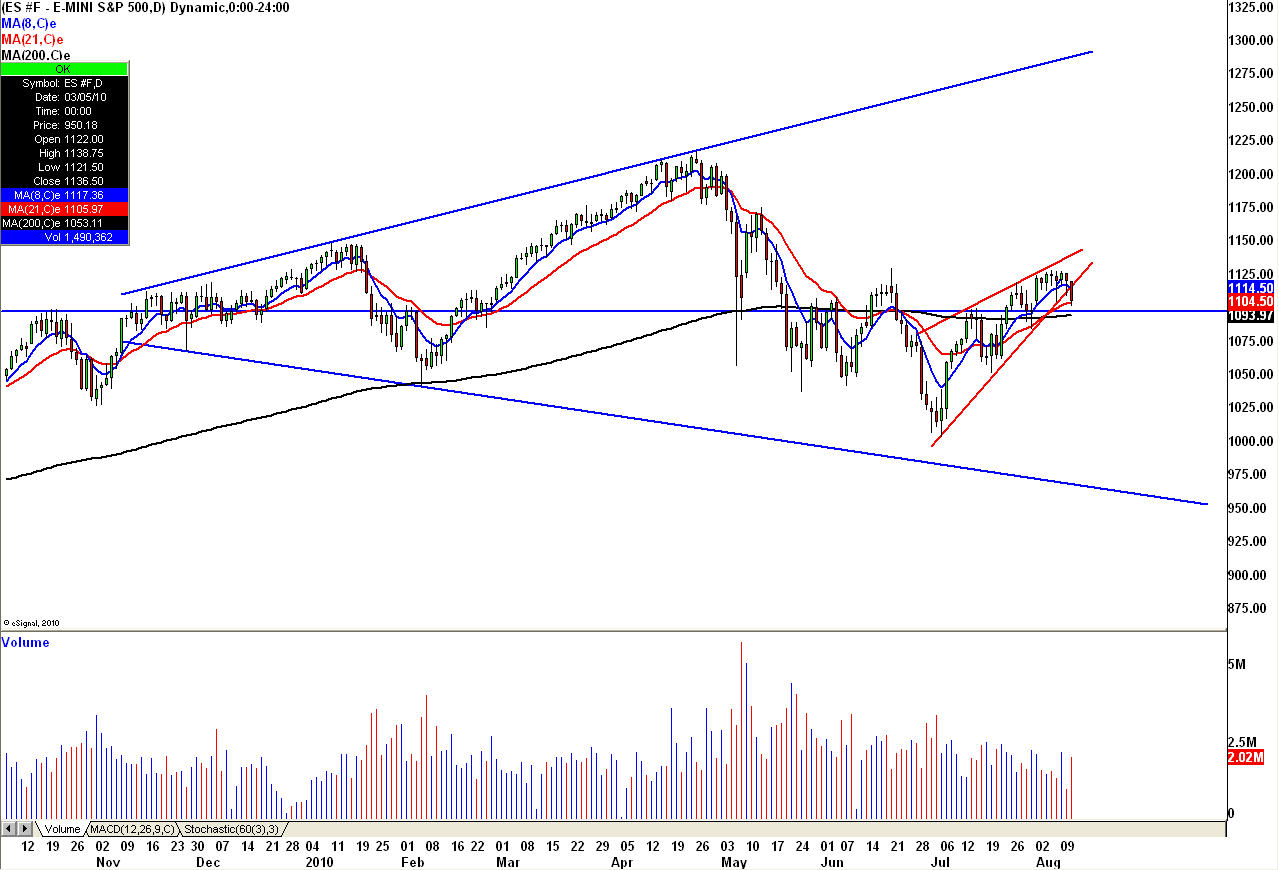
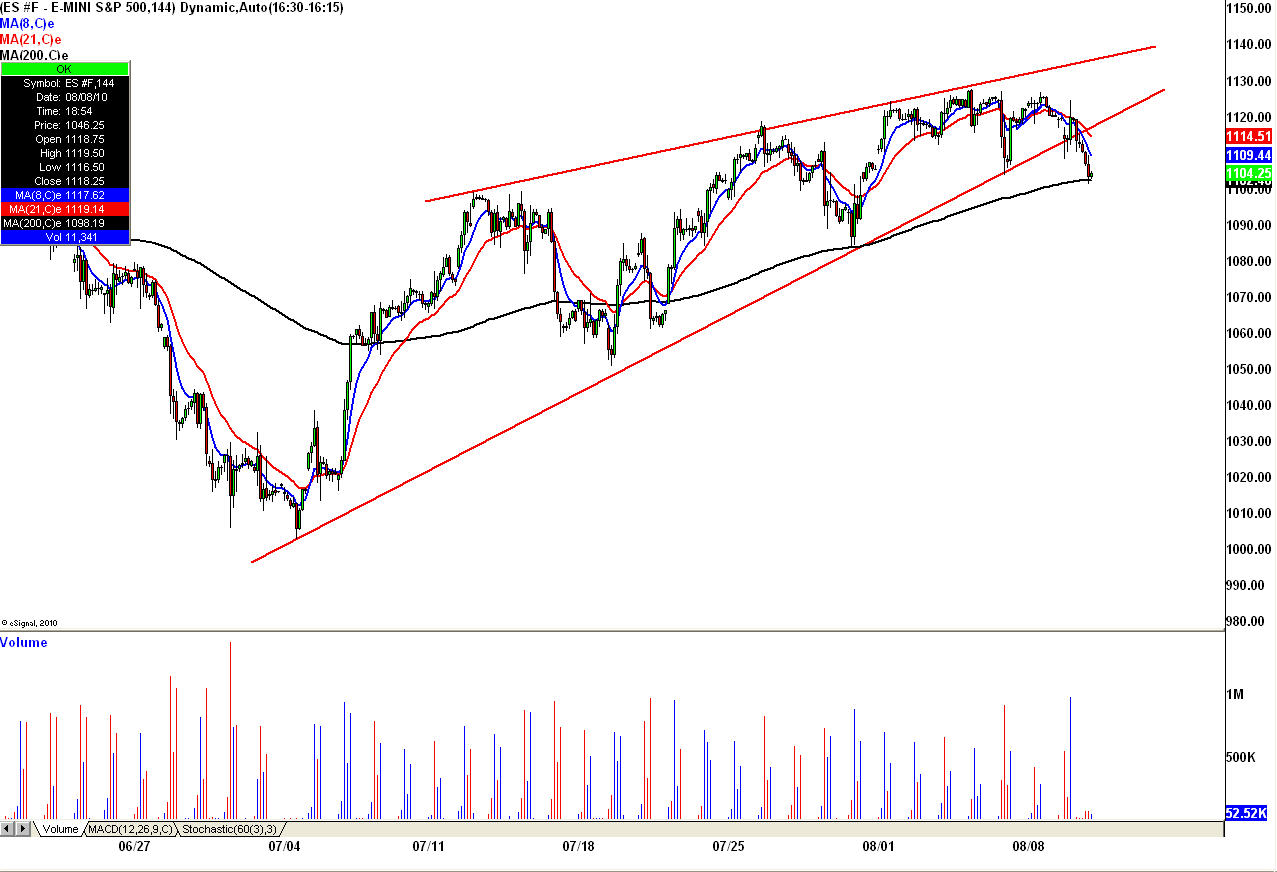 Since mid June I have been updating the “bigger picture” pattern that I believed was developing in the S&P 500 index . I want to take this time to update this situation as it has been building a pattern within a pattern that I believe will be disastrous in the near term for those not prepared. I have included 2 charts: The first is the larger bearish expanding triangle pattern that will take this market significantly lower over more time and the second chart which highlights the most current rising bearish wedge that has been building over the last 30 trading days or so. BE VERY CAREFUL HERE AS WE ARE BREAKING THE LOWER BOUNDARY OF THIS WEDGE. This pattern generally retraces to where it began (1000) and usually much lower.
Stocks

