
By: Evan Lazarus
As I sat today and listened to CNBC’s Sue Herrera discuss the impending technical head and shoulders pattern it dawned on me that it just might not be that easy. I mean if Sue Herrera is talking about it and this post popped up on zero hedge today http://www.zerohedge.com/article/cold-shoulder-goldman-warns-if-1040-taken-out-sp-865-next-stop, can it really just be? Now don’t get me wrong, I certainly am not here to downplay what looks to be visually evident at this point but perhaps suggest an alternative technical pattern (but much less obvious) that I believe has been in play for quite some time that may be worth watching in addition to the very much en vogue H&S.
Now before I get into discussing what I think is happening here let me first throw a little trader education into the mix. Why are patterns important?
A pattern gives the technical analyst clues on how to read the chart and, in turn, determine the movement of stock prices in the future.
By observing and studying these patterns over many years, experts have developed their own interpretations of how to read them, the level of reliability they will ascribe to them, and other factors that need to be taken into consideration when analyzing the pattern.
Time, for example, is an important element in understanding patterns and reading a chart. The longer the period of time covered the more complete the visual record and the more valuable the chart in practical study and analysis.
A technical analyst has a distinct advantage over a fundamental analyst because the technician has “the big picture.” A technical analyst has the ability to follow many more markets than a fundamental analyst who tends to focus on one market at a time. By watching more markets and stocks, the technical analyst avoids “tunnel vision” and can see more opportunities as they develop.
Even if technical analysts did agree on a specific chart, their trading approaches could be extremely different from one another, based on their trading methods. Day traders, for example, would trade a pattern far differently from a long-term investor as they are looking for different things from the market and are willing to assume different levels of risk.
That all being said, this is my interpretation of what I believe is happening here in the broader markets both short term and intermediate term.
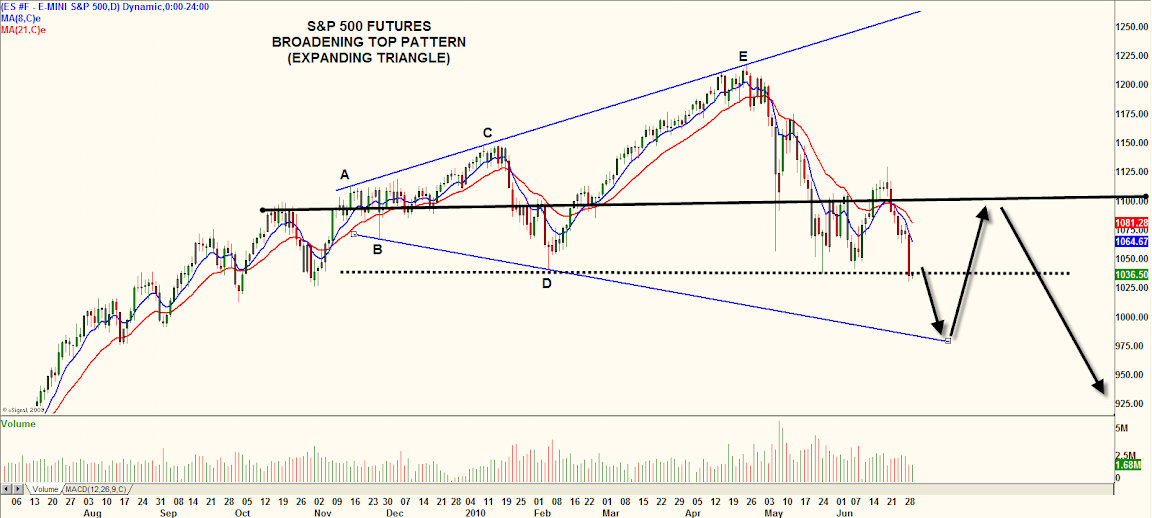
I have highlighted a potential 5 wave broadening top pattern which is very hard to see to the untrained eye AND is very chaotic in nature as the pattern tops out after making a series of higher highs and lower lows.
I suspect in the immediate future we will continue lower and probe the lower boundary of the lower declining trend line and then thrust back up off that level (best guess 975 +/- in the S&P) in what would amount to a necessary corrective rally possibly back to the median line (1100-1110 area) before continuing much lower (see arrows). This is obviously open to interpretation and evaluation but this would not be totally unexpected as it would put the bears on the run again before another potential devastating move were to unfold.
Now I have also highlighted the “neckline” of the over-hyped H&S pattern (1040 level) as this is an actionable area for many traders and will probably be an area many use as support and resistance going forward, but i suspect you will see this level traded through many times going forward as I do not believe the markets are truly in the mainstream pattern everyone including Sue Herrera seems to believe.
My job as an educator and trader is to respect the trend but make sure I have an actionable plan that sometimes isn’t so mainstream. While the herd can be a profitable place, we all know what happens to the herd if you stick around too long.
Talk to you on the Virtual Trading Floor.

