
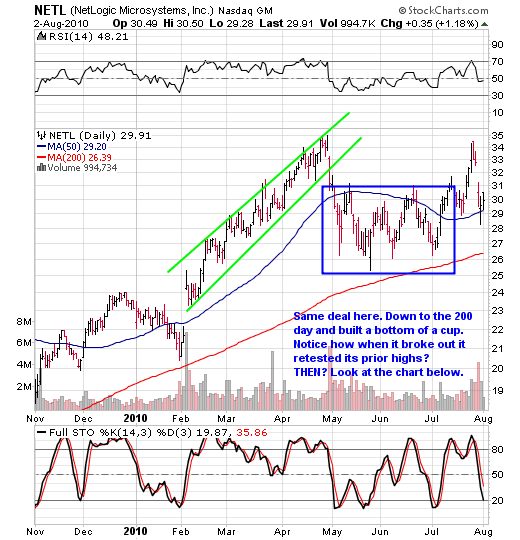
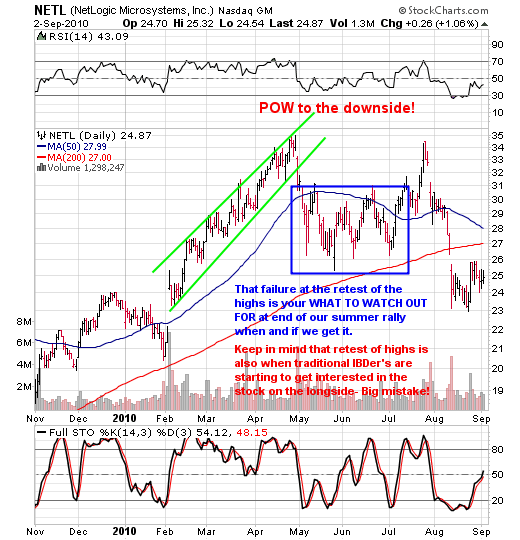
There are numerous leaders that have tagged the 200 day average and holding. This is typical in market corrections. What we’ll want to see is if these names can now go range bound and build all new bases over the next 3-6 months.
So lets take a look at a few examples of this from the past as to why we are interested in the 200 day moving average.
BRCM and JNPR below are blasts from the past, namely the summer correction of the year 2000!
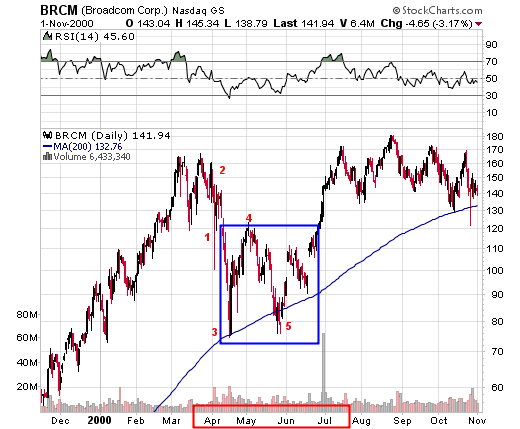
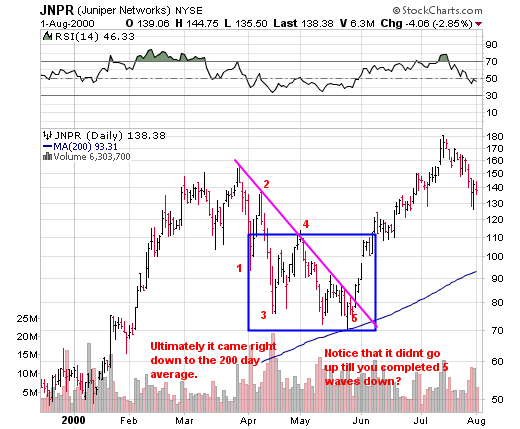
With the two charts above (BRCM and JNPR) what we want you to notice is that of yes each pretty much tagged the 200 day before stabilizing and moving higher. But not only that, they both did not go higher till they completed 5 waves down! The blue boxes show the rangebound trade above the 200 day and that of what a lot would say is the bottom of a cup.
While we are on the subject of 5 waves down and just how important that is feast your eyes on the next few charts.
First up is a current chart of SINA:
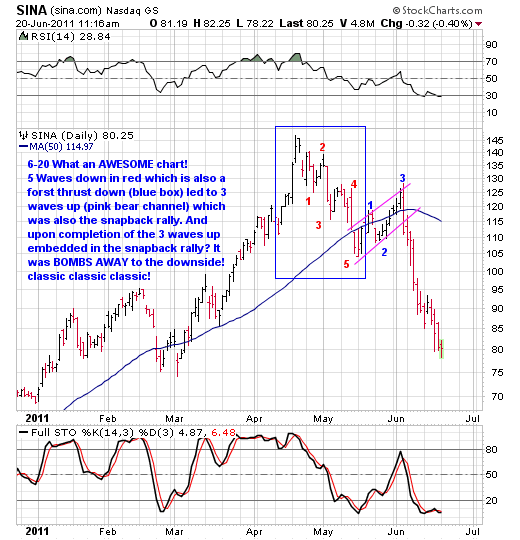
Notice what happened AFTER the 5 waves down sequence? Yep 3 waves up as shown above.
Moving on, lets look at another chart that is still in what looks to be its 5 waves down sequence. It’s a current chart of the US dollar.
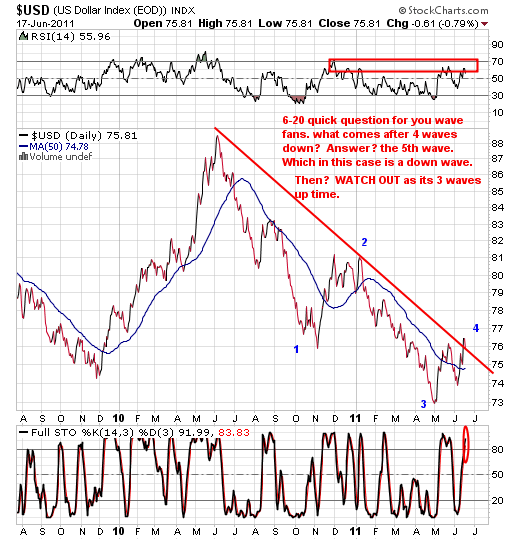
If we were to overlay a chart of the markets on top of this chart you’d see that waves 2 and wave 4 (both were up waves) corresponded with overall market weakness.
That’s why we say WATCH OUT after we get the 5 waves down. By the way a 5th wave down in the USD could also correspond with our summer rally in the general market, another bit of confluence for you all to consider and fits with our forecast of a summer rally WAVE 2 (3 waves up). And after our summer rally? Well it’s into the fall, literally. IF IF IF the market has truly topped that is. And if we are completing the first leg down (wave 1, which we are following that script btw) which again leads to a wave 2 summer rally then upon completion comes the wave 3 to the downside. The chart below from the past gives you a clue as to what that COULD (notice we didn’t say what is or what will transpire? we said could) occur. We’ll monitor as we go out in time.
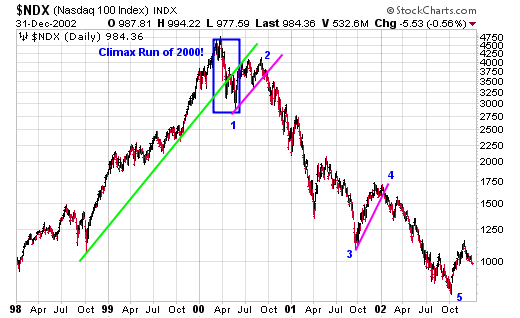
Notice the wave 2 bounce in the summer and into the fall? All we have to say is IF IF If the CURRENT market follows its current script then its mimicing this chart. If it happens? Consider yourself warned. Also consider us having this time over the next few months to prepare for it by getting defensive during the summer rally (raising cash on strength) and to be prepared in advance because it’s a HUGE HUGE short selling opportunity. That is exactly why we are going to put a lot of time in around here during the summer getting ready for this OPPORTUNITY should it occur.
Now what would that look like to names who have came down to the 200 day, chewed around built bottom of cups below the 50 above the 200 day and then took off to the upside in right side of cup crossovers? Take a look at the chart below.
To learn more, sign up for our free newsletter and receive our free report — “How To Outperform 90% Of Wall Street With Just $500 A Week.”

