
SODA is setting up nicely. But do we just go out and blindly buy it? No. Instead, we must ask ourselves:
“What Do I Need To See To Take This Trade”
When looking at SODA’s chart, the answer to that question is simple:
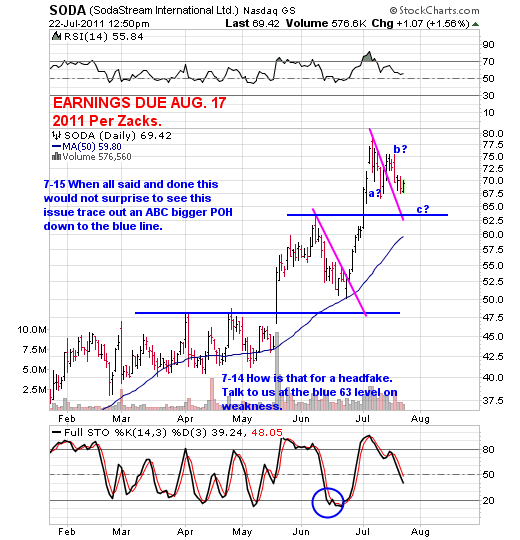
For those of you familiar with Elliot Wave, you can see SODA appears to be in the process of completing a classic A-B-C down pattern. This is the ideal way a stock consolidates recent gains. Upon completion of the pattern, the final C-wave should have the stock sitting at or near support as shown by the blue lines and 50-day moving average. Or if the stock is really strong, a retest of the lows from the A-wave would be about it. You can see it recently completed a similar pattern in June before going from 54 or so to almost 80 in just a matter of days!
So when do we buy SODA again this time around? Simple, on any pullback to the blue line. As long as it remains above that level and the 50-day, there’s a lot to like about this chart.
Now let’s take a look at a recent example of a stock that completed the same pattern and is in the process of setting up again:
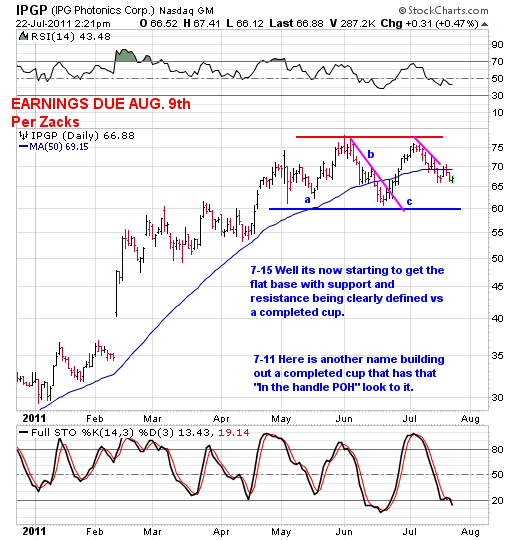
As you can see here, IPGP completed the same A-B-C pattern as it consolidated gains to an area of support. The place to initiate a trade was a break above the pink line. IPGP promptly went on a tear from $63 to $75 in just days! And it’s setting up again!
This is exactly the kinds of set-ups we look for and put on the watch list in our newsletters.
To learn more, sign up for our free newsletter and receive our free report — “How To Outperform 90% Of Wall Street With Just $500 A Week.”

