Monday 21 September 2009
The Wheat market as viewed from three different charts tell a story.
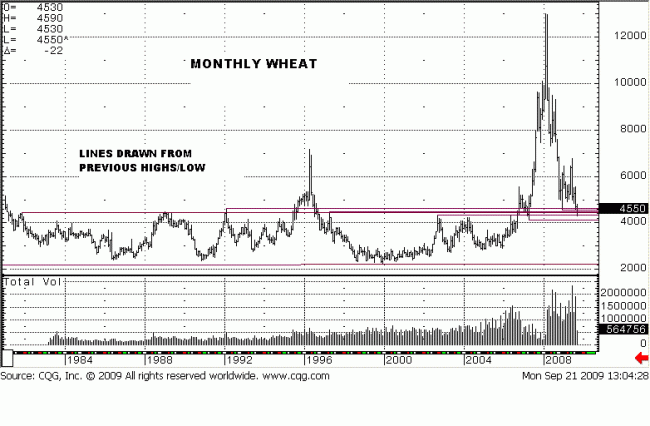
Wheat – Monthly
Important high and low price information:
Oct 1982 retest rally high = 444.4, from which a horizontal line is drawn.
Jan ’89 high = 449
Feb ’92 high = 463, from which a horizontal line has been drawn.
Retest rally high, Mar ’97 = 449, from which a horizontal line has been drawn.
Sep ’02 high = 434, from which a horizontal line has been drawn.
Breakout correction low, Apr ’07 = 412, leading to the $13 high, horizontal line drawn.
These are the important historic highs and lows in wheat.
The highest volume ever was in Jun ’09, an OKR, [Outside Key Reversal], low end
close…sellers clearly in control…[but how much of that was net selling v beginning
accumulation? No answer for that.]
Poor demand rally in July.
August followed with more high volume, but the monthly range, relative to similar
high volume bars is the smallest range for that degree of volume activity. [= range more controlled and creating a double bottom, relating to previous parenthetical
observation] Results not = to effort.
Current month shows a dramatic drop in volume…no selling pressure, at all. It is
the smallest volume, emphasis on small, relative to volume bars of the past 18
months.
With one more week to go, and recognizing that anything can happen, no
conclusion can yet be drawn until the month closes. That is not to say opinions
cannot be formed based on current market activity, as shown, and adjusted, if
need be, as present tense market activity develops.

Weekly
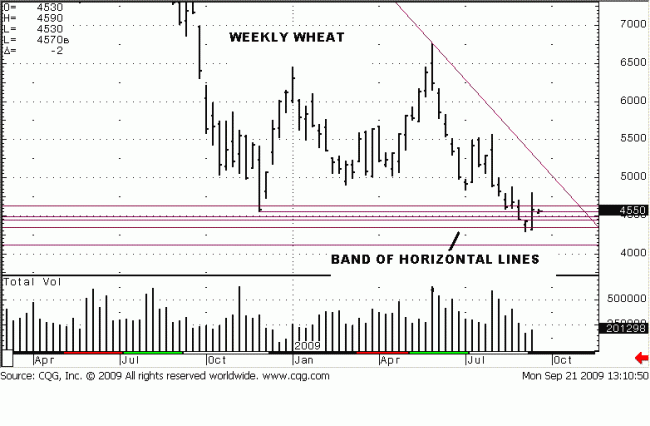
Down trend line from $13 high broken in Jan ’09. Tells us the down trend has
weakened. Price continued to hug the trend line until 2 Mar when the down trend
changed into a trading range within which wheat still trades.
The low close established week of 1 December ’08 trapped all sellers under $5 and
created a failed probe lower. As the trading range continued to develop, the high
volume KR [key reversal] high in June, [volume activity noted on monthly
assessment], said that a retest of the Dec ’08 low was highly likely, and could even be exceeded to create a new lower probe, as has/is happening.
The weekly ranges down from the Jun high have been small, more controlled.
[There is a message there.] After the OKR week of 3 August, also on high volume, the ranges down into the current low have also been small and controlled. No panic selling.
It looks like the high volume, small range bar following 3 August is a change from
strong hands’ selling to weaker hands. Two weeks later, 24 August, wheat volume
spurts higher on a small range bar that closes above the opening and above the
previous week…it is also a higher low, higher high, higher close bar, despite the
“seeming” weakness of the bar. [It is a positive show of results].
Where does smart money buy, in a trading range? At the bottoms, of course. The band of lines represents the monthly highs and lows mentioned previously in the
monthly assessment. The low of 429, week of 8 September is the smallest range
since Mar ’07, and volume declined. Clearly a shortening of the downward thrust
creating a bottom potential that needs confirmation. Given where price is in the
band and relative to the Dec ’08 low, $4 or a new low may not be a certainty, even
though many may consider it a probability.
When a price situation changes, so too, should you.
Last week’s rally bar, is a neutral to positive read, on a slight increase on volume.
Its significance, at this point, is that it may have created a new lower
probe…possibly a final one, but it requires confirmation.
Price has been moving along the right hand side of the TR toward a final resolve,
yet to be determined.

Daily
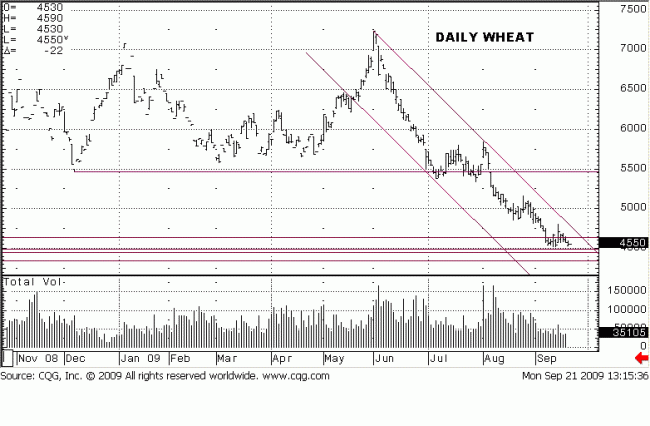
All of the horizontal lines drawn from the higher, more controlling monthly time
frames are still shown on the current daily chart. A channel from the June highs
has been drawn to keep the market in perspective.
The Monthly and Weekly trends are in a Trading Range. The daily is within the
confines of a sideways market, but of late, shows down…right into the band of
previous price levels. Volume for September has dropped to the lowest levels of
the year. The most recent volume spike of 9 September is the 4th bar from the
end. It was a rally bar that went nowhere, and one would have to conclude that it
was failed demand. The next two bars are lower closes, and volume drops on the
lower prices, a show that little selling pressure exists when it would be so easy to
wash out weak longs and create more shorts.
The lack of ranges extending lower, and the lower volume may be telling us that
selling is pretty much spent. Also note that the activity at the lows is occurring away from the bottom of the channel line and nearer to a breaking of the upper portion
of the supply cannel line, and that shows an ability to not go lower when, and where price is quite vulnerable.
No one knows what will happen from here, but there are a lot of clues that can lead
to taking some decisive action, depending on how price develops on this right hand side of the trading range, and at the bottom of a down channel.
The questions to be answered are, will there be one more washout, creating a
terminal probe on the daily chart, or will price just shoot up, “unexpectedly” and
leave all the shorts in the wheat chaff?
Granted, no one has the answer, but many should have developed a game plan.
We have one.


