The US dollar is at tipping point. Here are why:
JPY chart
Yenn chart is flat. But the is because of enourmous disaster Japan suffers.
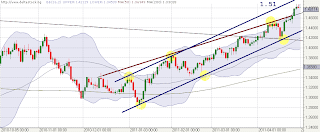
EUR/USD daily
The bearish wedge was broken from the wrong side and now, the price will go to 1.51
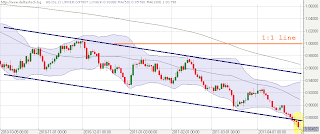
USD/CHF daily
Here we have no wedge, but support was broken and price going down.
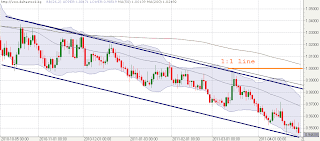
GBP chart
GBP chart is same as CHF.
USD/CAD chart
Here price is at the support level
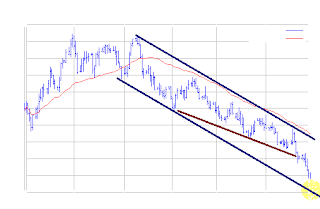
USD Index – 6 mo period
Here situation is as in EUR/USD. , broken from the “wrong” side. WedgeThis is “normal” because UDX is overweight with EURo.
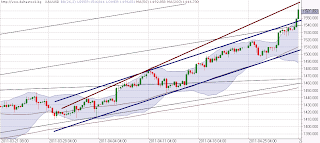
Gold 4h
Here upper channel is broken as in CHF chart (but chart is 4h instead of 1 day!!!).
Brown line could be a new channel top. Previous channel top could be a support.
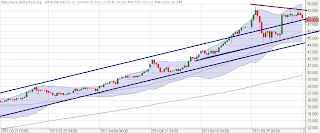
Silver 4h
Here previous channel was broken, and we have a triangle.
Triabgle may be broken any moment or price may fall to next support levels – different blue lines.


