

There has been a lot of news coming out of the Middle East and the pace of stories only seems to be increasing. So what’s next for crude oil in light of what is going on?
Well the good news is that you don’t need to follow (or anticipate) the news from the Middle East to know how to trade crude oil.
Below is a daily chart of crude oil futures showing continuous front-month data reaching back into the middle of last year. At i10 Research, we use volume-at-price information (red histograms) to identify important support and resistance zones and trade opportunities well in advance. This type of volume-at-price analysis is a highly reliable method for identifying key levels of support and resistance in any market (not just crude oil).
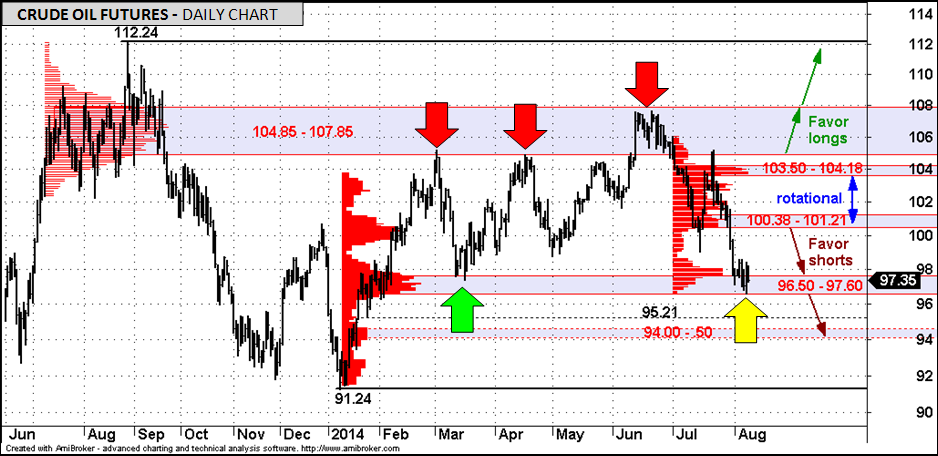
The highs of March and April this year, as well as the high in June (red arrows), were all at an important zone of resistance that was established over the summer and fall of 2013. The March low (green arrow) found support at an important high-volume support area established during the rally of January and February.
The lows of last week (yellow arrow), are in the same support zone established at the beginning of this year at 96.50 – 97.60. The near-term trend is bearish while below resistance at 100.38 – 101.21, which favors a downside resolution to the recent consolidation. The next downside targets are 95.21 and then 94.00 – .50.
A move below 96.50 would suggest that the next leg lower in the present decline is underway. Only a move over 98.63 would instead indicate a further bounce toward our higher zone of resistance at 100.38 – 101.21.
= = =

