Republished post
Recent news coming out of Washington, Wall Street and the rest of the world have been uniformly discouraging. Just where on the range are the deer and antelope expected to play if the bear is running rampant through their turf? Through the cloudy skies, however, I am beginning to pick up on a glimmer of sunlight trying to break through the clouds.
Where you say? Why, on the market tape, of course. The tape in the US stock indices are green today, on a day when bearish inputs were fairly high. The Nikkei was down 11% overnight, yet the next day we are p 4.5% shortly before settlement.
What gives, didn’t we have several bad news stories this morning? Yes, we did. Earnings on balance were not impressive. Philly Fed plunged to -37.5 its largest month over month decline ever, Industrial Production fell -2.8% aided by one-off hurricanes and Boeing strike. These were the bearish inputs and the market is up 3.5% And predictably the SP500 was down sharply this morning, trading as low as 865. But it has since gone on to recover 80 points or 10% from today’s intraday lows. Perhaps, things are starting to get better….

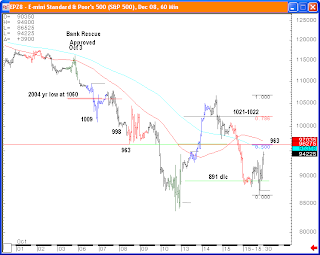
The chart above shows the SP500 recovering this afternoon from the 891 daily low close of Friday Oct 10 and is on its way back to challenge 963 and 1021-1022 near term.
Bullish inputs today came from easing LIBOR tensions, jobless claims declined for a second week in a row, and the CPI report was benign as expected. Keep a close ear to the market tape, it would appear downside risks are no longer accelerating on many fronts. Further confirmation this might be the case would be two consecutive higher daily closes back above the 9/11 crisis low at 939 in the SP500. Do that, and I believe we will see more encouraging words boosting morale on the street.
The reason 2 consecutive higher daily closes above 939 are so important near term is the fact that the SP500 still shows correlation to the 1929 Crash in Oct – Nov 1929. I would like to see the SP500 begin to deviate from that crash map. The analog chart below shows that following a two-day 32% rally in Oct 1929, the Dow Jones promptly crashed another 30%. Notably, before plunging to new lows, it paused after plunging about 5% below the Oct 29 1929 daily low close. But it only caught a one day bounce into Friday Oct 22 before the crash resumed.
The problem near term for the SP500 is that after its two-day 27% rally on Oct 14 08, the crash resumed. Like the Dow in 1929, it paused today after plunging 3% below the Oct 10 08 daily low close and bounced admirably. If the bounce is only one day, and unsustainable and closes poorly on Friday, that would be a signal that keeps us on the 1929 crash map. This would not not portend well for the onset of next week. But the key here is to listen to the tape and trade what you see. And what I see is that the market supported the daily low close, hence the tape today is telling us that the bad news may be priced in now with all trading above the daily low close at 891.
The initial confirmation that we are deviating from the 1929 crash map will be a breach of the bear gap down high at 981, not far from here. So, we want to see a two day follow through of higher daily closes in the SP500 and a breach of 981.


