
Since hitting $1,900 an ounce through the beginning of October, gold has declined nearly 11 percent. Over the same timeframe, the NYSE Arca Gold Miners Index lost almost 13 percent. That’s a closer performance correlation than the roughly 3-to-1 gold equities to bullion ratio we’ve historically seen and could mean the miners are finally closing the gap.
However, TD Securities Equity Research points out this interesting fact: Over a period of 18 months prior to hitting $1,900, gold rose 79 percent but TD’s basket of gold equities only increased 57 percent. The firm says this performance gap “ranks as the worst relative performance of gold equities to gold since 2001.” During the July through September period of 2008, TD Securities’ universe of gold equities declined 46 percent, while gold bullion only lost 24 percent. In October through November of 2008, the same gold equities lost 37 percent; while gold decreased 22 percent.
What’s behind today’s record disparity?
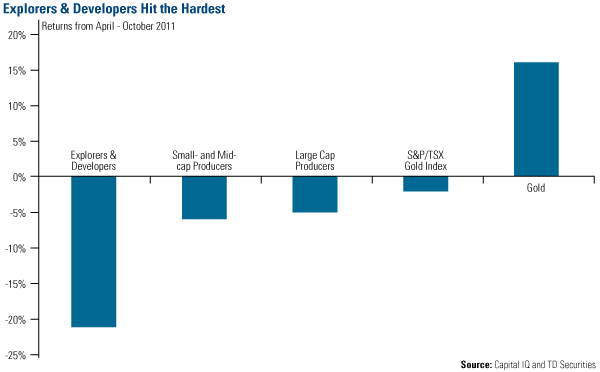
Part of it may be due to the underperformance of the explorers and developers, which, TD says, “have been hit the hardest.” The chart below shows gold miners by capitalization and their returns since April 2011. Explorers and developers have declined the most, losing 21 percent, small- and mid-cap producers have declined 6 percent and large producers lost 5 percent.
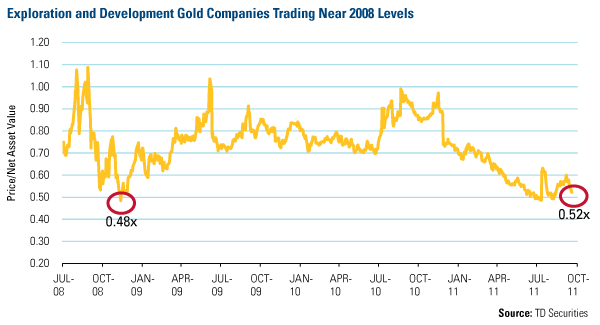
Because of the dramatic price decline in these early-stage companies, investors have the opportunity to purchase explorers & developers (E&D), often referred to as juniors, at about half of the company’s net asset value (NAV). In simplest terms, the NAV means assets minus liabilities. In fact, you can see from the chart that the current price-to-NAV level for E&D equities is sitting near record low levels…levels not seen since the financial crisis of 2008.
TD found that in seven of the past 10 rallies, gold equities beat gold—averaging a beta of 1.4 times. Looking over the next year or so, we believe the smaller gold miners are especially poised to outperform this time. As TD says, “on a rebound, we expect the best performing equities to be among the ranks of the explorers and developers.”
At U.S. Global, our World Precious Minerals Fund (UNWPX) is designed to take advantage of these types of opportunities—nearly half of the fund’s holdings are in smaller gold companies. This has caused the fund to lag many of its peers but we believe knowledge and expertise on the lesser-known names in the gold space have fueled the long-term outperformance of the fund compared to its benchmark, over the past decade.
As you can see below, a $10,000 hypothetical investment in the index 10 years ago is worth a little more than $52,000 as of September 30, 2011; however the same investment during the same time in UNWPX is now worth $81,000.

The chart illustrates the performance of a hypothetical $10,000 investment made in the fund during the depicted time frame, compared to its benchmark index. Figures include reinvestment of capital gains and dividends, but the performance does not include the effect of any direct fees described in the fund’s prospectus (e.g., short-term trading fees) which, if applicable, would lower your total returns.
| YTD | 1 Year | 5 Year | 10 Year | Since Inception | Gross Expense Ratio | Expense Ratio After Waivers |
|---|---|---|---|---|---|---|
| -29.49% | -17.48% | 5.37% | 23.30% | 6.83% | 1.85% | 1.90% |
Expense ratios as stated in the most recent prospectus. The expense ratio after waivers is a voluntary limit on total fund operating expenses (exclusive of any acquired fund fees and expenses, performance fees, taxes, brokerage commissions and interest) that U.S. Global Investors, Inc. can modify or terminate at any time. Performance data quoted above is historical. Past performance is no guarantee of future results. Results reflect the reinvestment of dividends and other earnings. Current performance may be higher or lower than the performance data quoted. The principal value and investment return of an investment will fluctuate so that your shares, when redeemed, may be worth more or less than their original cost. Performance does not include the effect of any direct fees described in the fund’s prospectus (e.g., short-term trading fees of 0.50%) which, if applicable, would lower your total returns. Performance quoted for periods of one year or less is cumulative and not annualized. Obtain performance data current to the most recent month-end at www.usfunds.com or 1-800-US-FUNDS.
Please consider carefully a fund’s investment objectives, risks, charges and expenses. For this and other important information, obtain a fund prospectus by visiting www.usfunds.com or by calling 1-800-US-FUNDS (1-800-873-8637). Read it carefully before investing. Distributed by U.S. Global Brokerage, Inc.
Gold, precious metals, and precious minerals funds may be susceptible to adverse economic, political or regulatory developments due to concentrating in a single theme. The prices of gold, precious metals, and precious minerals are subject to substantial price fluctuations over short periods of time and may be affected by unpredicted international monetary and political policies. We suggest investing no more than 5% to 10% of your portfolio in these sectors.
The NYSE Arca Gold Miners Index is a modified market capitalization weighted index comprised of publicly traded companies involved primarily in the mining for gold and silver. The index benchmark value was 500.0 at the close of trading on December 20, 2002. Beta is a measure of the volatility, or systematic risk, of a security or a portfolio in comparison to the market as a whole. The S&P/TSX Global Gold Index is an international benchmark tracking the world’s leading gold companies with the intent to provide an investable representative index of publicly-traded international gold companies.
All opinions expressed and data provided are subject to change without notice. Some of these opinions may not be appropriate to every investor.

