 Head and shoulders, knees and toes.
Sorry, I can’t think head and shoulders without adding the second part thanks to the darned Wiggles, which my kids were raised on – better than Barney, at least… The head and shoulders investors care about is the chart pattern (from the Chart Store) and, frankly, I could make a knees and toes case by extrapolating the left side of this disaster (which was actually a great bull run but would not be as much fun if we flip it).
TA is all about symmetry and pattern recognition, two things that are hard-wired into the pleasure center of the animal brain to help us develop cognitive skills early in life. Humans love finding patterns – it makes us happy. In this particular case, the fact that stocks go up and down and then get overbought and then get oversold as they correct to the mean has been cleverly identified by one primate (and I hope he gets a copyright fee) as a “head and shoulders” pattern and all the other media primates gather around the great obelisk and they howl and shriek at you every day and they cast their bones and make proclamatiotion as to what it foretells.
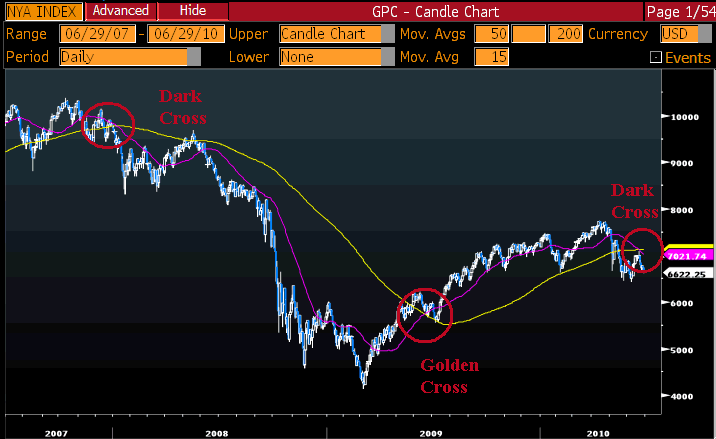
Unfortunately, Technical Analysis has so many devout followers that it often becomes a self-fulfilling prophesy. Even worse (and certainly more significant) than the head and shoulders pattern is the coincident “death cross” or “dark cross” that is being formed on our indexes (see yesterday’s post) as the 50-day moving average falls below the 200-day moving average, as indicated on this chart from Barry Ritholtz:

Mary Ann Bartels, Chief Bone-Caster at BAC, made the follwing prediction about the pattern she was seeing:
June 23, 2010 marked the 1-year anniversary of last June’s bullish Golden Cross of the 50-day moving average above the 200-day moving average. This Golden Cross signal preceded a 12-month return of 22.4% on the S&P 500. The average 12-month return for the 42 Golden Crosses that have occurred since 1928 is 9.6%. More importantly, the June 23, 2009 signal occurred during the NBER recession that began in December 2007 and Golden Crosses associated with recessions show a much stronger average 12-month return of 19.5%. The average 12-month return for the S&P 500 over the same period is 7.2%…
The bearish counterpart of the Golden Cross is called a Dark Cross. This signal occurs when the 50-day moving average crosses below the 200-day moving average. For the S&P 500, Dark Crosses…


