
A new bout of fear gripped financial markets during the past week, causing the slide in global stocks, commodities and emerging-market assets to deepen. As investors’ angst escalated, positions in risky assets were liquidated in exchange for perceived safe havens such as the US dollar, government bonds and gold bullion.
“We have seen fundamental selling, technical selling, forced selling (deleveraging), short selling, capitulation selling and selling due to ennui,” commented David Fuller (Fullermoney).
Fueling the sell-off were mounting concerns that the economic recession could not only be more intense than previously feared, but also fall into a corrosive deflationary phase. Additionally, sentiment was undermined by renewed questions about the effectiveness of the US government’s bailout plans.
A clear sign of distress and fear was the US three-month Treasury Bill rate falling to zero on Thursday, before nudging up to (a still minuscule) 0.10% by the close of the week. “The financial situation at the moment is so bad that women are now marrying for love,” quipped an e-mail doing the rounds.
After the S&P 500 Index breached the grim milestone of the October 2002 lows and fell to levels last seen in 1997 – thereby threatening to wipe out the entire 2002 to 2007 bull market – Wall Street regained some confidence late on Friday. The trigger for a strong turnaround arrived just in time for the 15:00 witching hour and came in the form of Timothy Geithner’s (pronounced GYTE-ner) nomination as new Treasury Secretary, resulting in the S&P 500 recovering from an intraday loss of more than 1% to a gain for the day of 6.3%.

On the bailout front, the Detroit automakers sought $25 billion from the Treasury to avert bankruptcy. However, Congress withheld financial aid for the time being, giving the companies until December 2 to submit a “viable” recovery plan.
“Don’t be misled, though – the something that is rotten in the auto industry has nothing to do with the credit crunch, and everything to do with years of mismanagement, shoddy products and bad choices,” said Bloomberg columnist Mark Gilbert. “Consider the credit-rating histories of GM and Ford. For both companies, the rot started all the way back in August 2001, when Standard & Poor’s put the A grades they enjoyed for a decade on review for downgrade. In October of that year they each suffered a two-level cut to BBB+ that left them just three moves away from junk status.”
I received the following note from an American friend a few days ago: “…even the children in my son’s second grade class are depressed about the auto industry. I had to answer my son’s questions about bankruptcy since the kids are talking about it …” This comment says it all!
Elsewhere, Citigroup’s (C) share price plunged by 60.4% over the week to a 16-year low as the company wrestled the financial crisis and planned to slash 50,000 jobs. According to The Wall Street Journal, “Citigroup officials have been talking in recent days to Treasury Department and Federal Reserve officials, and those discussions are expected to continue throughout the weekend …”
A pointed comment regarding the principle of bailouts came from Jim Rogers, as quoted by the Financial Times: “What they’re doing is taking the assets away from the competent people, giving them to the incompetent people and saying to the incompetent: ‘Okay, now you can compete with the competent people, with their money.’ I mean this is terrible economics. This is outrageous economics.”
Next, a tag cloud of the text of the plethora of articles I have read since a week ago. This is a way of visualizing word frequencies at a glance. Keywords such as “banks”, “economy”, “market” and “prices” occur often, but words such as “gold” and “deflation” have also started creeping into the tag picture.

The following update on the stock market outlook arrived on Friday from Bennet Sedacca (Atlantic Advisors): “We have been barely invested, mostly void, in equities, since May. We went ½ long today near the lows for a rally that could last longer than some think. Mostly large cap, high-quality, excellent balance sheet companies with a little tech and financials thrown in. We must remember, buy when you can, not when you have to.”
Oversold conditions are bound to result in rallies from time to time (and possibly around Thanksgiving), but these should not be trusted at face value. For a more lasting market turnaround to happen, I would like to see evidence of base formations on the charts, a 90% up-day, and relative outperformance by the financial sector.
I am also closely monitoring the surges in the US dollar and Japanese yen – low-yielding currencies previously used for funding risky investments – as a break of the uptrends in these two currencies will be a good indicator of the forced deleveraging selling starting to subside. Once this situation has played itself out, we should see a return to lower volatility levels and a return of confidence. (Also read my recent posts “Economic woes torpedo stock markets” and “Panic-crash sentiment causes extreme volatility“.)
Before highlighting some thought-provoking news items and quotes from market commentators, let’s briefly review the financial markets’ movements on the basis of economic statistics and a performance round-up.
Economic reports
The Ifo World Economic Climate has worsened further in the fourth quarter of 2008 with the indicator falling to its lowest level in more than 20 years, according to the Ifo World Economic Survey. Not only the major economic regions of North America, Western Europe and Asia are affected, but also Central and Eastern Europe, Russia, Latin America and Australia. On the whole, the survey data point to a global recession.

Economic reports released in the US during the past week confirmed an increasingly dire situation.
• The US moved closer to deflation territory as the CPI decreased by 1.0% from September to October (the largest monthly decline since the 1930s), leaving the CPI 3.7% higher compared with a year ago and significantly down from September’s 4.9% rate. The continuing decline in US economic activity is pushing down inflationary pressure.
• Because of weak demand, producer prices for finished goods gave up ground for the third month in a row, falling by 2.8% in October largely as a result of much less expensive energy products.
• On par with expectations, residential construction slowed again in October, with a 4.5% month-on-month decline in total housing starts. At 791,000 annualized units, starts have hit another record low as exceptionally weak demand was constraining homebuilding.
• The NAHB housing market index fell further in November, setting a record low.
• Slumping demand is hitting US industry hard, although production bounced back in October from hurricane-related declines in September. Total industrial production increased by 1.3% after having fallen a downwardly revised 3.7% in September, but the indicator fell around two-thirds of a percent in September and October when excluding once-off effects.
• Initial claims for unemployment insurance benefits increased by 27,000 to 542,000 for the week ended November 15, putting claims at their highest point since the early 1990s. This is a serious warning signal about the health of the labor market.
• The Conference Board Index of Leading Economic Indicators declined by 0.9% in October, led by a sharp plunge in stock prices and decreases in residential building permits and consumer expectations. The LEI in the last three months has shown an acceleration in the rate of decline, adding to evidence that the US has entered a recession that will likely be much deeper than either of the previous two.
It comes as no surprise that the minutes of the Federal Open Market Committee’s meeting of October 28 to 29 indicate that members were extremely concerned about the near-term prospects for the economy, given the stresses in financial markets. With the problems in credit markets persisting, the FOMC’s forecast called for falling growth through the first half of 2009, with next year’s real GDP growth projection lowered to -0.2% to 1.1% (previously 2.0% to 2.8%).
Banks continue to hoard all the liquidity the Fed is injecting directly instead of lending it out. This raises the question: Is the Fed “pushing on a string”? Asha Bangalore (Northern Trust) commented as follows: “The lowering of the Fed funds rate, the Fed’s innovative programs to provide liquidity to financial institutions and more lenient rules for borrowing through the discount window appear to have exhausted the gamut of possibilities routed through monetary policy changes to influence aggregate demand.
“The provisions of the Emergency Economic Stabilization Act of 2008 allow for recapitalization of banks. The FDIC is working on obtaining an approval for the anti-foreclosure plan to address the housing market issues that are central to the current crisis. … the probability of a hefty fiscal stimulus package … is growing every day.”
Economic reports in other parts of the world were equally dismal.
Japan entered into its first recession in seven years as the financial crisis curbed demand for its exports. GDP growth contracted by 0.1% during the third quarter, or at an annualized rate of -0.4%, following a second quarter contraction of a massive 0.9%.

Source: Financial Times, November 17, 2008.
China also warned that the unemployment outlook was “grim” as a result of the financial crisis forcing the closure of more export-oriented factories.
In Europe, a further slowdown in economic activity caused the Swiss National Bank to announce a surprise 100 basis-point cut in its three-month target range to 0.5%-1.5% – the third emergency reduction in two months.
Week’s economic reports
Click here for the week’s economy in pictures, courtesy of Jake of EconomPic Data.
|
Date |
Time (ET) |
Statistic |
For |
Actual |
Briefing Forecast |
Market Expects |
Prior |
|
Nov 17 |
8:30 AM |
NY Empire State Index |
Nov |
-25.4 |
-26.0 |
-26.0 |
-24.6 |
|
Nov 17 |
9:15 AM |
Oct |
76.4% |
76.5% |
76.5% |
76.4% |
|
|
Nov 17 |
9:15 AM |
Oct |
1.3% |
0.1% |
0.2% |
-2.8% |
|
|
Nov 18 |
8:30 AM |
Core PPI |
Oct |
0.4% |
0.0% |
0.1% |
0.4% |
|
Nov 18 |
8:30 AM |
Oct |
-2.8% |
-2.0% |
-1.8% |
-0.4% |
|
|
Nov 18 |
9:00 AM |
Net Foreign Purchases |
Sep |
$66.2B |
NA |
$17.5B |
$21.0B |
|
Nov 19 |
8:30 AM |
Oct |
708K |
760K |
772K |
805K |
|
|
Nov 19 |
8:30 AM |
Core CPI |
Oct |
-0.1% |
0.1% |
0.1% |
0.1% |
|
Nov 19 |
8:30 AM |
Oct |
-1.0% |
-0.7% |
-0.8% |
0.0% |
|
|
Nov 19 |
8:30 AM |
Oct |
791K |
780K |
780K |
828K |
|
|
Nov 19 |
2:00 PM |
FOMC Minutes |
Oct 29 |
– |
– |
– |
– |
|
Nov 20 |
8:30 AM |
11/15 |
542K |
505K |
503K |
515K |
|
|
Nov 20 |
10:00 AM |
Oct |
-0.8% |
-0.7% |
-0.6% |
0.1% |
|
|
Nov 20 |
10:00 AM |
Philadelphia Fed |
Nov |
-39.3 |
-30.0 |
-35.0 |
-37.5 |
Source: Yahoo Finance, November 21, 2008.
Next week’s US economic highlights, courtesy of Northern Trust, include the following:
1. Existing Home Sales (November 24):Sales of existing homes are predicted to have declined in October after a small gain in September. Sales of existing homes advanced by 7.8% from a year ago in September, after posting declines since late 2005. Consensus:5.00 million versus 5.18 million in September.
2. Real GDP (November 25): Incoming economic reports suggest a small downward revision of real GDP in the third quarter to a 0.5% drop from the advance estimate of a 0.3% decline. Consensus: -0.5%
3. New Home Sales (November 26):Sales of new homes are expected to have fallen in October after a 2.3% increase in September. Sales of new homes have dropped by 32.1% from a year ago in September. Consensus:450,000 versus 464,000 in September.
4. Durable Goods Orders (November 26):Durable goods orders (-2.0%) are predicted to have dropped in October reflecting declines in bookings of defense and aircraft, which posted large gains in September. Consensus: -2.6% versus +0.9% in September.
5. Personal Income and Spending (November 26):The earnings and payroll numbers for October indicate a steady reading for personal income in October. Auto sales fell sharply in October and non-auto retail sales were noticeably weak, pointing to a likely drop in consumer spending (-0.6%). Consensus:Personal income +0.1%, consumer spending -0.9%
6. Other reports:Case-Shiller Price Index, OFHEO Price Index, Consumer Confidence (November 25).
Click here for a summary of Wachovia’s weekly economic and financial commentary.
Markets
The performance chart obtained from the Wall Street Journal Online shows how different global markets performed during the past week.

Source: Wall Street Journal Online, November 14, 2008.
Equities
Global stock markets suffered badly during the past week on mounting worries about the severity of the economic slowdown. The week’s movements – MSCI World Index -9.6% and MSCI Emerging Markets Index -11.8% – tell the story of a rough ride for bourses all over the world and marked a third straight week of losses. And the scoreboard would have been even worse if not for a dramatic late-session recovery in the US on the news that Timothy Geithner would be named Treasury Secretary.
Not a single developed market closed the week unscathed. Similarly, large losses also abounded among emerging markets, with the sole exception being the Shanghai Stock Exchange Composite Index that recorded only a relatively small 0.9% decline. The Index plunged by 72.0% since its high of October 16, 2007 until hitting a low on November 4, but has subsequently bounced by 15.4% to flirt with its 50-day moving average and roundophobia 2000 level. Will the upside leadership for global stock markets come from China on this occasion?
The chart below shows the performances of the four BRIC countries during the past week.

Click here or on the thumbnail below for a (very red) market map, obtained from Finviz, providing a quick overview of last week’s performances of global stock markets (as reflected by the movements of ADR stocks).
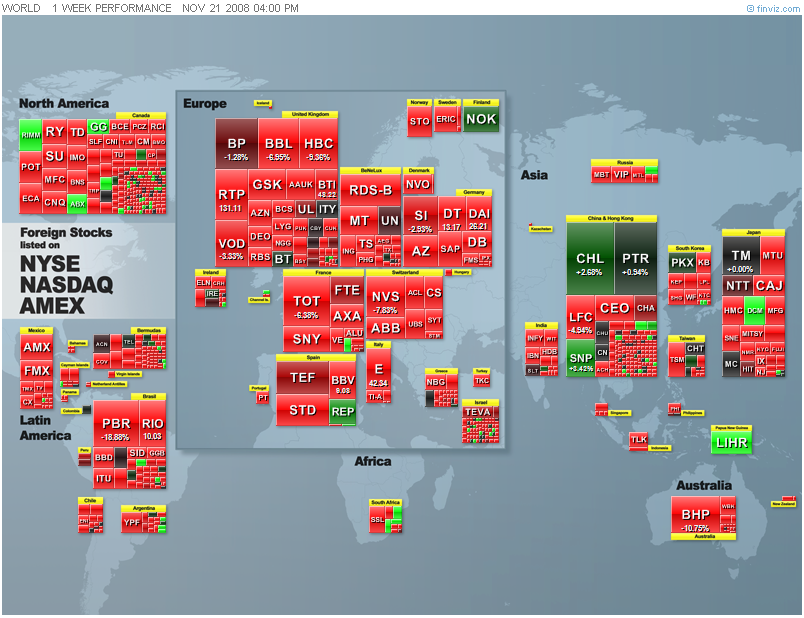
The US stock markets all declined sharply over the week as shown by the major index movements: Dow Jones Industrial Index -5.3 (YTD -39.3%), S&P 500 Index -8.4% (YTD -45.5%). Nasdaq Composite Index -8.7% (YTD ‑47.8%) and Russell 2000 Index -10.9% (YTD -46.9%).
The S&P 500 closed below its October 2002 low of 777 on Thursday, but Friday’s rally (+6.3%) to 800 put it back above this key support level. The Dow remained above its 2002 low of 7,286 on Thursday and closed 760 points above this level after Friday’s surge.
Click here or on the thumbnail below for a market map, also from Finviz.com, showing the performances of the various segments of the S&P 500 over the week.
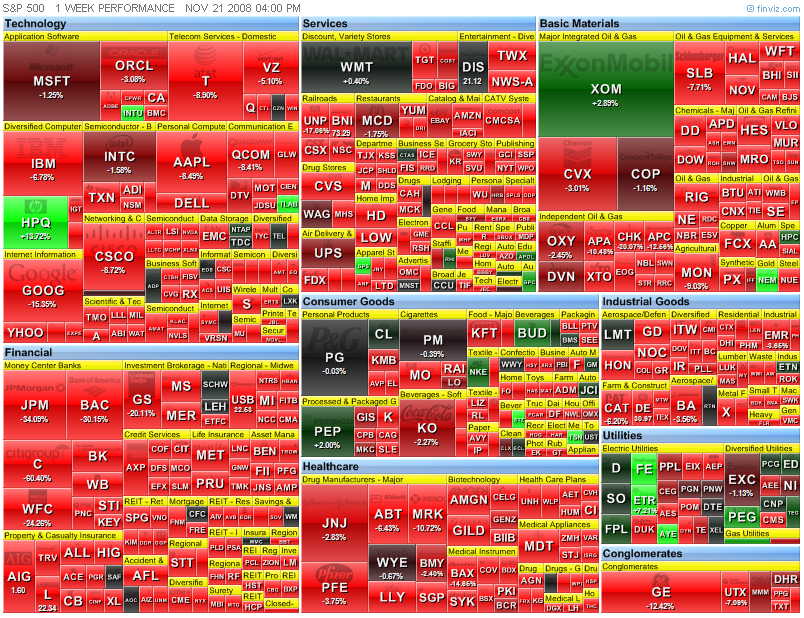
As far as industry groups are concerned, gold (+19%) was the top performer for the week, led by Newmont Mining (NEM) on the back of a sharp rise in the price of gold bullion.
On the other side of the performance spectrum, the industrial real estate investment trust (REIT) group (-40%) was the worst performer. The diversified financial services group (-38%) was the second worst performer, with each of the group’s large banks – Citigroup (C), JPMorgan Chase (JPM) and Bank of America (BAC) – dropping sharply. Investor concerns about future credit losses, valuations of “toxic” securities on the banks’ books, job layoffs and capital adequacy issues were the drivers for the declines.
David Fuller (Fullermoney) commented as follows on the outlook for stock markets: “… we have yet to see evidence of bottoming out on many major stock market charts. While this is worrying, to put it mildly, and sentiment is diabolical, investors should recall an extremely important behavioural conditioning process. The crowd has always turned progressively more bearish with each additional decline towards the eventual low for every bear market. This is inevitable as more people sell, and unfortunately, few are more bearish than a battered holdout who finally capitulates.
“If global stock markets are not close to a major buying opportunity, then I suggest we should all head to sea and become Somali pirates.”
Fixed-interest instruments
Government bond yields across the world plunged last week as spooked investors rushed out of equities into sovereign debt.
The ten-year US Treasury Note yield declined by a massive 57 basis points to 3.18%, the UK ten-year Gilt yield dropped by 20 basis points to 3.87% and the German ten-year Bund yield fell by 30 basis points to 3.38%. However, emerging-market bonds, in general, lost ground as further deleveraging took its toll on risky assets.
The yield on ten-year Treasuries touched a 5½-year low (3.01%) on Thursday before rebounding by the close of the week, whereas the yield on 30-year bonds dropped to its lowest level (3.53%) since the start of regular issuance in 1977 before snapping back by 14 basis points.

US mortgage rates also declined, with the 30-year fixed rate dropping by 9 basis points to 6.09% and the 5-year ARM also by 9 basis points to 5.89%.
A number of indicators show that the credit crisis is still severe. For example, credit default swaps that measure default risk for investment grade debt are trading at their highest levels of the bear market. This is seen from Bespoke’s index that measures default risk for 125 companies with investment grade debt ratings.

Currencies
The week’s feature among currencies was safe-haven flows into the US dollar and Japanese yen as investors liquidated risky assets previously funded with these low-yielding currencies.
The Swiss franc came under pressure as the Swiss National Bank slashed interest rates a full percentage point to 1% as an emergency step to soften the economic slowdown.
The chart below illustrates the accent of the US dollar and Japanese yen since September 15. (The US dollar is measured against a trade-weighted basket of currencies, whereas all the other currencies are measured against the US dollar.)

Emerging-market currencies had another bad week as a result of increasing risk aversion. Examples of losses against the greenback include the Brazilian real (‑10.4%), the Turkish lira (-4.5%), the South Korean won (-6.7%) and the South African rand (-4.4%).
RGE Monitor raised the question whether Bulgaria and the Baltic states will be forced to reset their fixed exchange rate pegs to the euro as a result of their large external imbalances and the global financial crisis. “Because of their fixed exchange rates, these economies cannot conduct independent monetary policy so the burden of macro-economic adjustment falls on fiscal policy.”
Commodities
The Reuters/Jeffries CRB Index (-6.5%) witnessed a further decline amid fears of a protracted global economic recession and expectations that demand will drop.
Gold bullion (+6.6%) bucked the trend and surged as the yellow metal found support among nervous investors as a safe store of value. A report that China might embark on a gold-buying program provided an additional boost.
On the other hand, West Texas Intermediate crude declined by a further 13.3% to $49.9 – a level not seen since May 2005. OPEC meets on November 29 to consider additional production cuts.
The graph below shows the movements of various commodities over the past week – a continuation of the intense bear market that has been in force since the beginning of July.

Lau-Tzu said: “Those who have knowledge, don’t predict. Those who predict, don’t have knowledge.” Wise words indeed, but hopefully the news items and words from the investment wise below will cast some light on the lie of the investment land. And may the markets bring you additional reason to celebrate a joyous Thanksgiving.
That’s the way it looks from Cape Town.

Source: Pat Oliphant, Slate

