
The holiday-shortened Thanksgiving week brought investors an additional item to be thankful for when stock markets closed higher for five consecutive trading days – a rare winning streak last accomplished in July 2007. The S&P 500 Index gained 19.1% since the start of the rally on November 21 and 12.0% on the week, registering the largest weekly gain since 1974.

Source: Daryl Cagle
Worrisome economic reports were cast aside by equity bulls, arguing that the bad news had already been priced in. However, US Treasury Note yields were less sanguine and fell to its lowest level on record, pointing to deflation concerns and suggesting that investors remained skeptical about the government’s latest moves to help revive the ailing economy. Importantly, US three-month Treasury Bills were trading at a minuscule 0.03%, indicating that liquidity was still being hoarded.
President-elect Obama stressed the need for quick action to expedite an economic recovery and introduced his administration’s economic team, including former Federal Reserve Chairman Paul Volcker as head of a new White House Economic Recovery Advisory Board tasked to revive growth in the US. Involving the 81-year Volcker in this way is a smart move by Obama.
A catalyst for last week’s stock market recovery was the announcement on Monday of the US government’s rescue plan for Citigroup (C), including a direct $20 billion investment and $306 billion in asset guarantees.
With credit markets still not thawing after the introduction of various central bank liquidity facilities and capital injections, the Fed on Tuesday unveiled further steps aimed at lowering borrowing costs for consumers and home buyers. The Fed will buy $100 billion of debt from Fannie Mae (FNM), Freddie Mac (FRE) and the Federal Home Loan Banks, and also purchase up to $500 billion of mortgage paper backed by the agencies. The Fed will furthermore lend $200 million to holders of key asset-backed securities regarding small business and consumer (auto, student, credit card) loans.

Source: The New York Times, November 25, 2008.
Commenting on the US government’s bailout actions and quoting from the Jerusalem Post, Bill King said: “There is one last thing that Hank, Ben and Geithner can do: ‘The country’s chief rabbis are calling for a mass prayer rally on Thursday in the hope that heavenly intervention will stem the global financial crisis.’”
Next, a tag cloud of the text of the dozens of articles I have devoured over the past week. This is a way of visualizing word frequencies at a glance. The usual suspects feature prominently, with “gold” attracting increasing attention.

Has the stock market reached a secular low or is it just bouncing off oversold levels? According to Fox Business Network, legendary investor Jim Rogers said: “We’re ready for a rally. I mean, the market in October and earlier this month has had a huge selling climax. I covered a lot of my shorts. Who knows if I’m right or not. But I expect the market to rally for some time. It may rally into next year. But … this is a false rally. It’s not going to be great. It’s not the end of the problems in America and it’s not the end of the bear market.”
A positive for the bulls is that the period post Thanksgiving through the end of the year has usually been a strong time for stocks. According to Jeffrey Hirsch (Stock Trader’s Almanac), “December is normally a banner month for stocks, ranking second [on the monthly calendar] for the Dow and S&P 500 and third for the Nasdaq.”
Should the bullish seasonal tendencies hold true on this occasion, possible first targets are the November 4 highs of 9,625 for the Dow (current level 8,829) and 1,006 for the S&P 500 (current level 896). This will also result in both indices clearing their 50-day moving averages.
“There is no doubt that time is needed for volatility to settle down before many will have the confidence to return to investing, but if one looks beyond the end of the year, 2009 will almost certainly be a better year for investors than 2008,” said David Fuller (Fullermoney) from London.
Although there is not yet conclusive evidence that we are leaving the corpse of the bear behind (especially with Q4 earnings disasters looming in January), it would appear that the nascent rally could have more steam left. (Also read my recent posts “Is the tide turning for stocks” and “Does the stock market rally have legs?“)
I am about to hit the road again – traveling to New York City – and blog posts will therefore take a back seat for the next week as I explore the Big Apple and meet with friends, blog readers and business associates in the cold weather and depressed economic climate.
Before highlighting some thought-provoking news items and quotes from market commentators, let’s briefly review the financial markets’ movements on the basis of economic statistics and a performance round-up.
Economy
“Global business sentiment is as dark as it has ever been, although the free fall in confidence may be over,” said the latest Survey of Business Confidence of the World conducted by Moody’s Economy.com. “Pessimism is pervasive across the entire globe, with the only distinction being that Asian businesses are somewhat less nervous than elsewhere. Pricing pressures are falling rapidly, although they are not yet consistent with outright deflation.” The global economy is suffering a severe recession according to the results of the business confidence survey.
Economic indicators released in the US during the past week all pointed to a deepening recession. According to Briefing.com, Q3 GDP was revised down to -0.5% from -0.3%, durable orders slumped by 6.2%, existing home sales fell by 3.1%, new home sales dropped by 5.3%, personal spending declined by 1.0%, and weekly initial claims, while improved from the prior week, continued to register a reading above 500,000.
The Chicago Purchasing Managers Index came in at 33.8, the weakest number since the serious recession of 1982. “The national number due next Monday will be just as ugly, as durable goods were down far more than expected, by a negative 6.2%,” added John Mauldin (Thoughts from the Frontline).

Commenting on the outlook for interest rates, Asha Bangalore (Northern Trust) said: “Going forward, real GDP is expected to show a decline that is upward of 4.0% in the fourth quarter of 2008. The Fed is widely expected to lower the Federal funds rate to 0.5% on December 16.” However, the Fed’s quantitative easing approach to monetary policy now seems to be targeting the quantity of money rather than its price.
Elsewhere in the world, the People’s Bank of China (PBoC) slashed its benchmark interest rates by 108 basis points and also lowered the reserve requirement for banks. This move indicates that China will be joining the rest of the world in a marked economic slowdown.
For the upcoming week, the European Central Bank and the Bank of England are expected to reduce interest rates by 50 and 75 basis points respectively in the light of a deteriorating economic outlook.
Week’s economic reports
Click here for the week’s economy in pictures, courtesy of Jake of EconomPic Data.
|
Date |
Time (ET) |
Statistic |
For |
Actual |
Briefing Forecast |
Market Expects |
Prior |
|
Nov 24 |
10:00 AM |
Oct |
4.98M |
5.07M |
5.05M |
5.14M |
|
|
Nov 25 |
8:30 AM |
Chain Deflator-Prel. |
Q3 |
4.2% |
4.2% |
4.2% |
4.2% |
|
Nov 25 |
8:30 AM |
GDP-Prel. |
Q3 |
-0.5% |
-0.3% |
-0.5% |
-0.3% |
|
Nov 25 |
10:00 AM |
Nov |
44.9 |
40.0 |
39.5 |
38.0 |
|
|
Nov 26 |
8:30 AM |
Oct |
-6.2% |
-2.2% |
-2.5% |
-0.2% |
|
|
Nov 26 |
8:30 AM |
11/22 |
529K |
535K |
537K |
543K |
|
|
Nov 26 |
8:30 AM |
Oct |
0.3% |
0.2% |
0.1% |
0.1% |
|
|
Nov 26 |
8:30 AM |
Personal Spending |
Oct |
-1.0% |
-0.6% |
-0.7% |
-0.3% |
|
Nov 26 |
9:45 AM |
Nov |
33.8 |
39.5 |
38.5 |
37.8 |
|
|
Nov 26 |
10:00 AM |
Mich Sentiment-Rev. |
Nov |
55.3 |
58.5 |
58.0 |
57.9 |
|
Nov 26 |
10:00 AM |
Oct |
433K |
450K |
450K |
457K |
|
|
Nov 28 |
9:45 AM |
Nov |
– |
NA |
NA |
NA |
Source: Yahoo Finance, November 28, 2008.
In addition to the Fed releasing its Beige Book (Wednesday) and interest rate decisions by the European Central Bank and the Bank of England (Thursday), next week’s US economic highlights, courtesy of Northern Trust, include the following:
1. ISM Manufacturing Survey (December 1): The consensus for the manufacturing ISM composite index is 38.4 versus 38.9 in October.
2. Employment Situation (December 5): Payroll employment in November is predicted to have dropped by 300,000 after 240,000 jobs were lost in October. The unemployment rate is expected to move up two notches to 6.7%. Consensus:Payrolls: -300,000 versus -240,000 in October, unemployment rate: 6.7% versus 6.5% in October.
3. Other reports:Construction spending (December 1), auto sales (December 2), ISM non-manufacturing, productivity and costs (December 3), and factory orders (December 4).
Markets
The performance chart obtained from the Wall Street Journal Online shows how different global markets performed during the past week.

Source: Wall Street Journal Online, November 28, 2008.
Equities
Global stock markets surged during the past week on the back of a combination of bargain hunting and short covering, albeit on light trading volume as a result of the Thanksgiving holiday in the US.
Both mature and emerging markets shared handsomely in the rally that commenced on November 21, as shown by the subsequent gains of the MSCI World Index (+15.7%) and the MSCI Emerging Markets Index (+13.5%). Notwithstanding the improvement, these indices are still down by 43.8% and 57.7% respectively for the year to date.

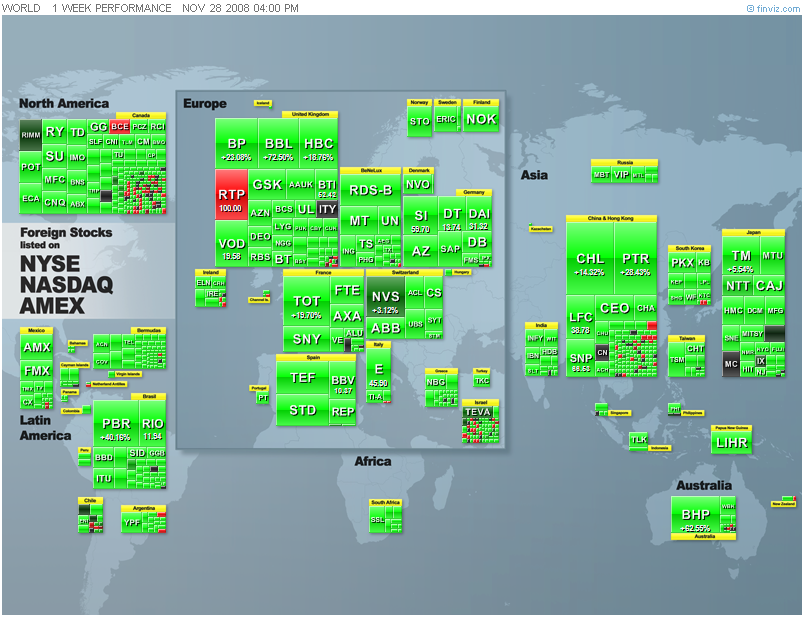
Click here or on the thumbnail below for a (delightfully green) market map, obtained from Finviz, providing a quick overview of last week’s performances of global stock markets (as reflected by the movements of ADR stocks).
The US stock markets all rallied sharply over the week as shown by the major index movements: Dow Jones Industrial Index +9.7 (YTD -33.5%), S&P 500 Index +12.0% (YTD -39.0%), Nasdaq Composite Index +10.9% (YTD ‑42.1%) and Russell 2000 Index +16.4% (YTD -38.2%).
The bar chart below, also from Finviz.com, shows the US sector performances over the week, and specifically how strongly financials and materials have recovered.

As far as industry groups are concerned, the automobile manufacturing group (+82%) was the top performer for the week. General Motors Corp (GM) and Ford Motor (F) rose by 71% and 88% respectively on the expectation that auto makers will receive a government bailout.
The homebuilding group (+59%) was the second-best performer on the prospect that the US government’s latest rescue package will result in lower mortgage rates and mortgage credit becoming more readily available.
Seven of the ten underperforming groups were from the three top-performing sectors for the year to date – consumer staples, health care and utilities. These sectors, which typically outperform in a declining market, tend to lag in a rising market such as the one experienced last week.
Interestingly, the percentage of S&P 500 stocks trading above their 50-day moving averages has increased from almost zero in October to 19% on Friday – a promising improvement.

I often get asked by readers about Richard Russell’s (Dow Theory Letters) latest views. This is what the old-timer said on Friday: “The big question now is whether the tide is in the early process of turning bullish. If so, we should be seeing a series of constructive, even bullish days. … I wonder whether my more aggressive subscribers shouldn’t jump the gun and maybe buy the Diamonds (DIA) at the opening on Monday.”
Fixed-interest instruments
The ten-year US Treasury Note yield declined to its lowest level since records began in 1958, closing 25 basis points lower on the week at 2.93% after falling as low as 2.82% earlier on Friday.

In addition to economic and deflation worries, Treasuries also benefited from lower mortgage rates as a result of the Fed’s decision to buy GSE-insured mortgage paper. The 30-year fixed mortgage rate dropped by 25 basis points to 5.84%.
“The lower mortgage rates threaten to trigger a wave of mortgage refinancing, the prospect of which has pushed investors to hedge that risk by buying ten-year Treasury debt, a benchmark for mortgage rates,” reported the Financial Times“.

The UK ten-year Gilt yield dropped by 9 basis points to 3.78% and the German ten-year Bund yield fell by 12 basis points to 3.26%. Emerging-market bonds also performed well, with the JPMorgan EMBI Global Index gaining 5.1% during the week.
Although some progress has been made as a result of central banks’ liquidity facilities and capital injections, the credit markets are not yet thawing (see my “Credit Crisis Watch” of November 28). The TED and LIBOR-OIS spreads have tightened since the panic levels of October 10, whereas the CDX and iTraxx indices have also shown some improvement over the past few days. However, US Treasury Bills and high-yield spreads are still at crisis levels.
Currencies
Most currencies rebounded against the US dollar during the past week as the greenback came under pressure as a result the Fed’s new measures to unclog the credit markets.
Over the week the US dollar lost ground against the euro (-0.8%), the British pound (-3.1%), the Swiss franc (-0.8%), the Japanese yen (-0.3%), the Canadian dollar (-2.4%), the Australian dollar (-3.7%) and the New Zealand dollar (-4.3).
The US currency also fell against emerging-market currencies such as the Brazilian real (‑7.7%), the Turkish lira (-6.0%) and the South African rand (-4.1%).
Interestingly, the Chinese renminbi (+6.9%) is the only major emerging-market currency that has appreciated against the US dollar over the year to date.

Commodities
The Reuters/Jeffries CRB Index (+4.7%) closed higher by the end of the week – only its fifth positive week since commodities peaked early in July. Arguing against a more lasting reversal of fortune for commodities, the Baltic Dry Index – a benchmark for shipping major raw materials, including coal, iron ore and grain, and generally an excellent barometer of economic activity – declined by 14.5% to its lowest level since 1987.
The graph below shows the movements of various commodities over the past week, indicating an improvement across the whole complex as a weak US dollar pushed prices higher.

Gold bullion (+3.4%) remained in favor with investors as a result of a solid supply/demand situation, store-of-value considerations and a positive-looking chart (see below). A research report from Citigroup, as reported by the Telegraph, said gold could rise above $2,000 within two years. Platinum (+6.9%) and silver (+7.6%) – massive underperformers since March – were also in demand last week.

In the aftermath of Thanksgiving, may I remind you of the following old stock market adage: “The bears have Thanksgiving and the bulls have Christmas.” Let’s hope for an early Christmas! Meanwhile, the news items and words from the investment wise below will hopefully assist in steering our portfolios on a profitable course.
That’s the way it looks from Cape Town.


