

Safeway (SWY) has been struggling to stay up with the broader market’s new highs and has continued to be short on bounces for the last few years.
BIG PICTURE ANALYSIS
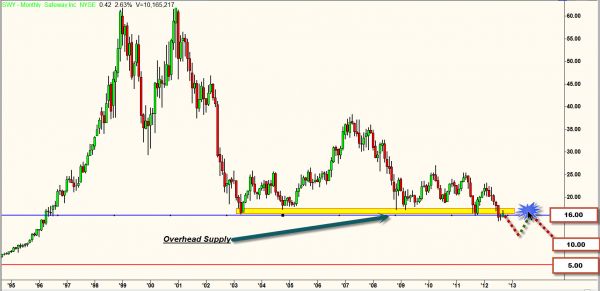
On July 21, 2011, SWY had an igniting gap down and closed below a pivot of support at $22.00. For the last year, SWY has traded between supply $22.00 and demand at $16.00. On July 12, 2012 SWY had a continuation gap down under $16.00 a demand point.
KEY LEVELS
SWY either needs to hold above demand $16.00 or it looks to be headed for lower prices. The monthly chart shows that SWY has a lot of overhead supply if it remains under $16.00.
THE TRADE
Short any bounce under $16.00. Target: short-term $10.00 off monthly chart; long-term $5.00 off monthly chart.
= = =
Recent stock and ETF stories:
Stocks: Solid Earnings, Decent Technicals on FIRE
Go On Safari: Access Africa With ETF Play
Looking for more trading ideas? Read out daily Markets section here.

