

Back in 2010 many proponents of technical analysis began to coin “The Lost Decade” to debunk conventional market wisdom, which argues that buy-and-hold no longer works with the current volatility.
For the S&P 500 Total Return Index 2000-2009 marked only the third decade in the history of the index that posted a negative real return, and it was only the second time in history that the index finished a decade with a negative nominal return. Unsurprisingly the only other decade in red was the 1930s. Keep in mind that there were two major culprits causing this during the period that are not to be brushed over: the Tech and Housing Bubbles.
LONG TERM BREAKOUTS
While this was happening, many of the Blue Chip companies have been trading range-bound with relative strength as we have seen other household names fall from graces. Mega-Cap Companies like Wells Fargo (WFC), Exxon Mobil (XOM), Wal-Mart (WMT), and Disney (DIS) have broken out or are on the verge of breaking out to new highs of months and even years of consolidation.
BANK STOCK
Beaten and battered, the “big bank” sub-industry, where companies like AIG (AIG), Citigroup (C), and Lehman Brothers have fallen left and right, has quickly gone from hero to zero. Others like JP Morgan (JPM) and Goldman Sachs (GS) who have survived the gauntlet, remain headline hogs, another big trade-gone-wrong away from a 25% stock price hit. The anomaly of this group seems to be Wells Fargo, which has weathered the storm quite nicely and is now breaking out from a three-year consolidation pattern.
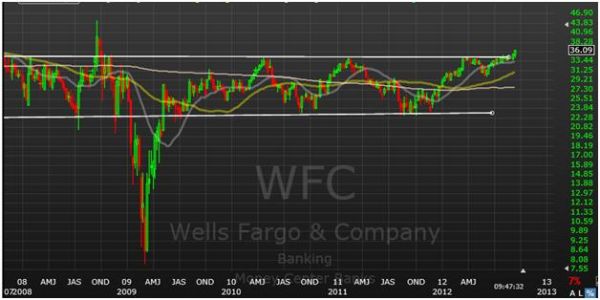
The weekly chart shows two trendlines ($34 and $23) where the price action has compacted throughout the past 39 months. This month, it has finally taken on that $34.00 level and broken out higher, taking on a new uptrend.
Energy has also been a hot topic as environmental concerns loom heavily on Capitol Hill. We saw BP’s Gulf of Mexico fiasco and now the push toward “cleaner” burning natural gas on which companies like Exxon Mobil (XOM) have been able to capitalize. Like Wells Fargo (WFC), Exxon is breaking out of a multi-year consolidation period.
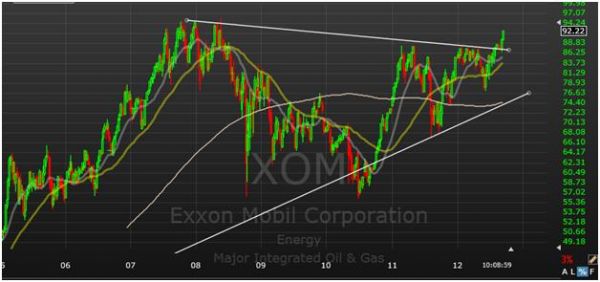
At the fourth attempt to break this descending resistance, Exxon (XOM) was able to break above the key $88.00 level in this bullish wedge and follow through to new highs in a longer term breakout.
Backing up again to 2000, there have been two worldwide household names that spent the summer breaking out of their decade of consolidation. Both Wal-Mart (WMT) and Disney (DIS) broke out to new all-time highs in late June and late May respectively. Both charts look similar and I see them as a very bullish sign for all U.S. equities. The monthly charts are shown:
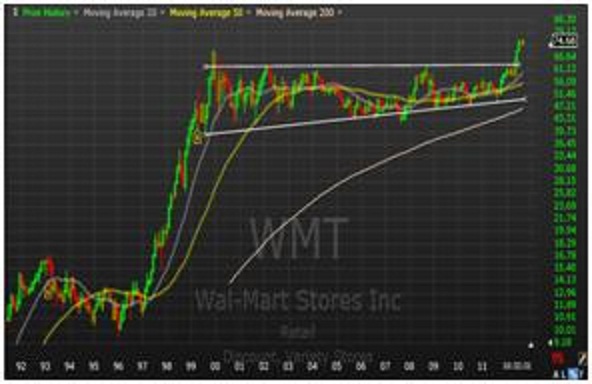
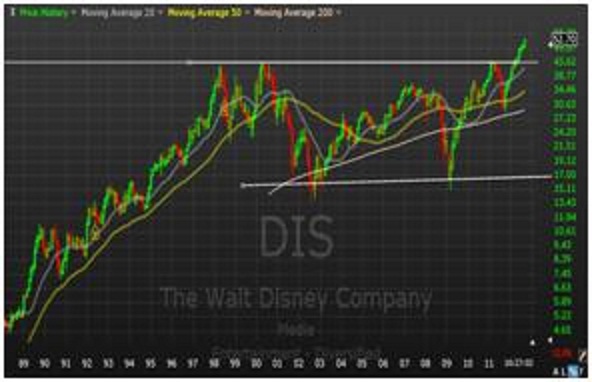
The resistance in Wal-Mart (WMT) ($62.00) and Disney (DIS) ($43.00) were broken through on their fourth attempts this summer, and both have followed through nicely.
DON’T MISS OUT
Generally considered “Blue Chip Tollbooths” that pay a consistent dividend and maintain a low beta, these stocks have begun to challenge new highs while the S&P 500 attempts to make its way back to the $1500 level of 20072. If the first three years of this decade are any indication of the decade to come, we won’t be talking about “The Lost Score” in 2020. Perhaps the Federal Reserve will have to hold our hand throughout, but as long as the markets keep gaining momentum, no matter the cause, these multi-year breakouts are ones to watch.
Source info:
econ.yale.edu/~shiller/data.htm
finance.yahoo.com/q/hp?s=%5EGSPC+Historical+Prices
= = =
For more trading ideas, read our Daily Markets section here.

