We are envious at times of those who can simply follow mechanical trading rules by buying or selling dispassionately when moving average lines cross or some arcane indicator turns higher or lower. Our passion isn’t so much being ‘right’ as it is knowing why we are ‘right’. In a strange sense this allows us be to wrong for extended periods of time as long as we know exactly why we are wrong.
Much of our work began in the post-1987 ‘crash’ time frame because we couldn’t be comfortable being exposed to any market that could literally wipe such a large percentage of a portfolio’s value out of existence in matter of a few days. 25 years later… the daily fixation to understand the seemingly random natures of the various markets continues.
We were asked yesterday why crude oil prices could fall 4 points one day and then rise an equivalent amount the next day. A somewhat saner answer would be ‘Middle Eastern tensions’ while one might also counter with ‘a weaker U.S. dollar’. Our response, as one might expect, was that it probably had something to do with Hewlett Packard (HPQ).
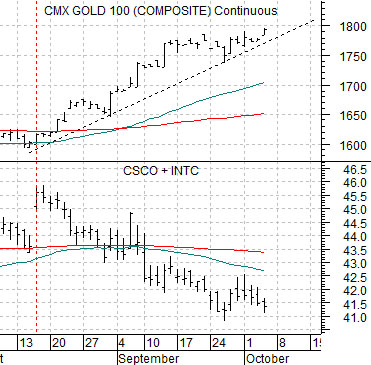
First is a chart of gold futures and the combination of the share prices of Cisco and Intel (CSCO + INTC). The argument is that ‘tech’ is a ‘stronger dollar’ trend while crude oil and gold rely on dollar weakness. Each time there is a major tech-related disappointment ranging from Intel’s recent earnings warning to HPQ’s mea culpa… money flows away from tech and the dollar in search of more hospitable treatment in other themes. In a rising market when one major sector is under pressure it is akin to putting your thumb on the end of a hose; the resultant flow of liquidity into competing sectors accelerates.
Another question is… why is the stock market rising so relentlessly in the face of a seemingly unlimited supply of bad news? Our answer would be that it is only ‘bad news’ if the bond market believe it to be so.
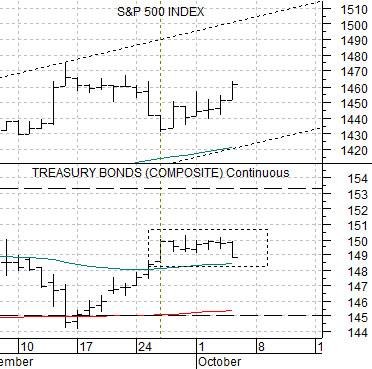
Next is a chart of the S&P 500 Index (SPX) and the U.S. 30-year T-Bond futures. We did this argument on page 5 last night but the idea is and was that the trend for the SPX was bearish as long as the TBonds were trending higher. Once the TBonds started to flatten out around the 150 level… the SPX began once again to swing upwards.
The point? If we get through today’s monthly U.S. employment report without an upward surge in long-term bond prices look for a continuation of the recovering trend that began 6 trading days ago.
Equity/Bond Markets
No help from the weekly jobless claims report but, then again, no real damage either. Now we have to wade through the notoriously inaccurate monthly payroll report.
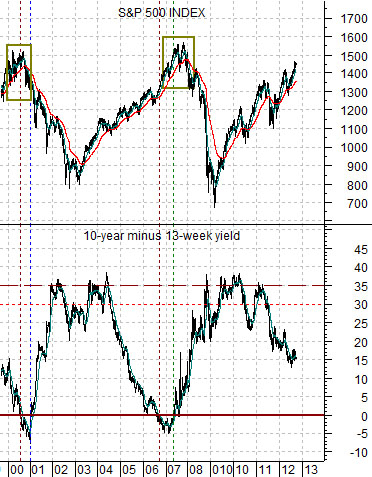
First… a big of perspective. Below is a chart of the S&P 500 Index and the spread or difference between 10-year and 3-month Treasury yields.
The time to start worrying about a stock market peak is when the spread falls to or below the ‘0’ line. This indicates an inverted yield curve which tends to apply the brakes to economic growth. It could take another year or three to get from here to there.
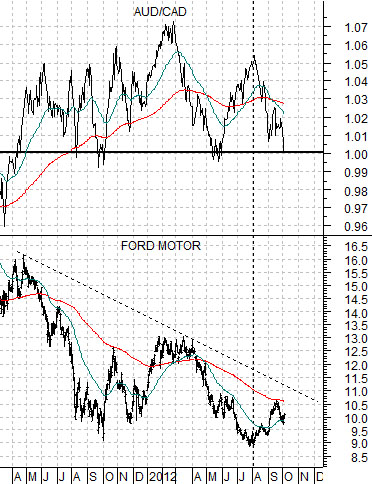
Next is a chart of Ford (F) and the cross rate between the Australian and Canadian dollar (AUD/CAD) futures. The cross rate closed almost exactly at 1.00 yesterday as money moves away from Asia. In 1997- 98 the offset to a falling AUD/CAD included strength in the commodity ‘users’.
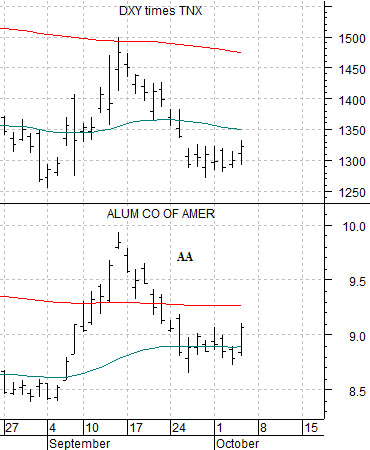
Last is our chart of Alcoa (AA) along with the combination of the U.S. Dollar Index (DXY) times 10-year U.S. Treasury yields (TNX).
The argument is that AA trends with the dollar and yields so, all things being equal, the stock will do better on days when yields are stronger and will also be helped by a rising dollar. Rising yields along with a weaker dollar tend to support the base metals stocks while a better dollar favors Alcoa.
The dollar was weaker yesterday but the rise in yields helped lift the DXY times TNX product as Alcoa moved a bit higher.