Once a year we get a bit of a gut twinge when we write October 19th for the date. Since we don’t recall the 1929 ‘crash’ the markets event that stands out the most to us was the ‘crash’ on October 19th of 1987. We remember turning on the quote machine that day and being asked what it means when the S&P 500 Index futures are down 30 points ahead of the opening. Reported prices were delayed by 30 to 60 minutes throughout the session with the SPX futures eventually losing around 81 points. While 81 points either way is always a big deal on a percentage basis it would be like the SPX closing yesterday at 1457 and then ending trading today at 1050. It would over 3 times worse than Google’s 8% swan dive yesterday.
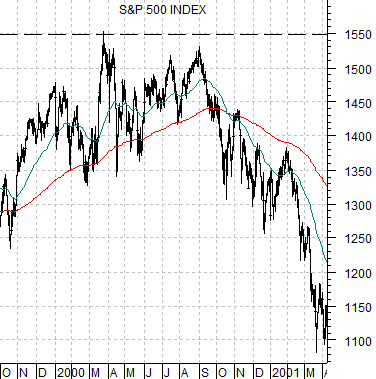
In any event… we have wandered off topic. Below is a chart of the S&P 500 Index (SPX) from 1999 into 2001.
The SPX seems to have a problem with the 1500- 1550 range. Given that the index is now within spittin’ distance of these levels we thought it was time to make an observation or two.
The tech sector pushed the index above 1500 in 2000 before collapsing. We could probably make the case that other sectors were leading to the down side but the reality is that the Nasdaq was the relative strength leader into the spring of 2000.
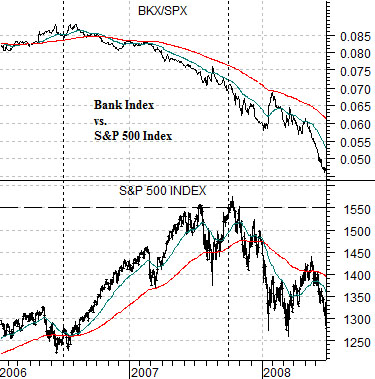
Below is a chart of the SPX and the ratio between the Bank Index (BKX) and SPX from 2006- 08.
The SPX rose back up to 1500- 1550 into 2007. The autumn of 2007 was the peak for a number of sectors including… China. The final quarter of 2007 was the point in time when crude oil prices began to ramp to the upside on the way to the cycle peak in mid-2008 as rising energy costs helped to bring global growth to a screeching halt.
The twist is that even as the major index was driving to the highs the banking shares were losing rather serious relative strength. The 2008 markets collapse was preceded by a couple of years of erosion for the bank stocks as the BKX/SPX moved steadily lower.
As we once again approach the 1500- 1550 level we wonder whether the markets are in the process of ‘splitting’ once again as certain sectors push upwards even as some of the former leaders start to weaken. Our thought today is that the closer the index gets to 1550 the more likely we are to see a pronounced split between strong and weak sectors.
Our view is that the markets today appear similar to late 1996. We will add to this argument on page 5 using a U.S. dollar comparison. Riveting stuff.
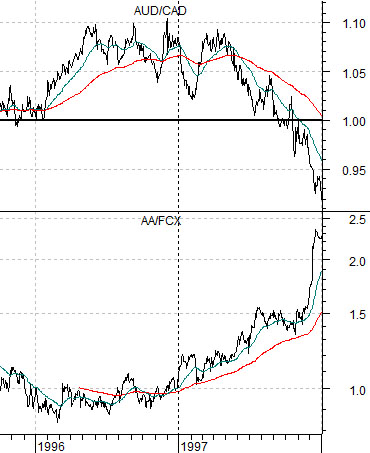
We have done this one before but when we get our teeth into something we tend to do it over and over again. At right are two charts of the cross rate between the Australian and Canadian dollars (AUD/CAD) and the ratio between Alcoa (AA) and FreePort McMoRan (FCX).
The AUD goes with Asian economic strength. The CAD is more sensitive to North America. When both are declining the trend for commodity prices is negative. When both are rising the trend is positive. Commodity prices tend to rise with Asian growth so typically a pro-commodity trend will include a rising AUD/CAD.
Alcoa- in our view- relates more to autos. FreePort McMoRan is tied more closely to Asian construction.
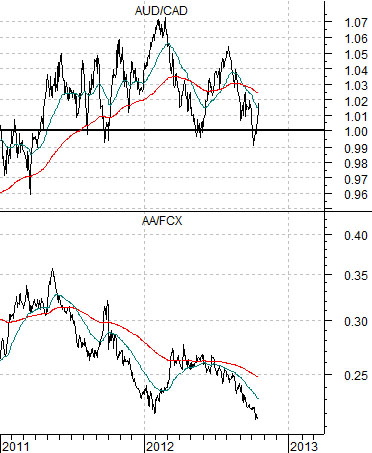
The peak for the cross rate between the AUD and CAD in 1996 marked the low for AA versus FCX. The chart below shows the current situation.
We have a clear potential top for the AUD vs. CAD but we have yet to get to the point where the share price of AA is stronger than that of FCX. This makes us think that this is more of a 1996-type market than 1997.
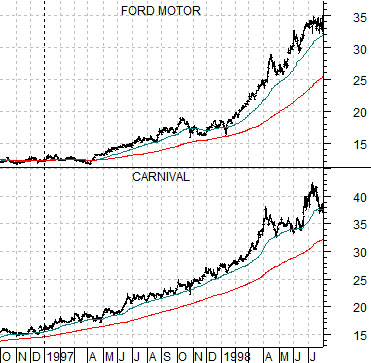
This becomes important because 1997 was the last time the autos and airlines really went on a tear. There was downward pressure on the commodity currencies as well as energy and base metals prices even as the share prices of Ford (F) and Carnival (CCL) tripled. The chart below shows that both stocks were at or below 15 around the end of 1996 and both rose into the 35+ range into 1998.
The point is that we are watching the relative strength of Alcoa versus both the broad market as well as the base metals miners in the hopes that our positive view on the autos and airlines makes sense.