

Have you ever wondered what Japanese “candlesticks” are, where they came from or perhaps how to use them properly to improve your trading decisions? This article will provide you with more insight to these questions.
Prior to 1989 candlesticks were unknown to the Western world – Steve Nison is responsible for changing that. His book, Japanese Candlestick Charting Techniques, became the foundation of all candlestick charting work in the West.
HISTORY OF CANDLESTICKS
From the late 1500s to the mid -1700s Japan progressed from sixty provinces to a unified country where commerce blossomed. Military conditions immersed Japan for centuries, hence it is no wonder that many candlestick terms are based on battlefield analogies such as ‘night and morning attacks,’ and the ‘advancing three soldiers pattern.’
FIRST FUTURES EVER TRADED
The first rice exchange was developed in the mid-1600s in Osaka on Yodoya Keian’s front yard. This market was later institutionalized with the opening of the Dojima Rice Exchange in the late 1600s in Osaka. Prior to 1710 actual rice was dealt. Post-1710, the Rice Exchange issued and accepted rice warehouse receipts (rice coupons). These coupons/receipts became the first futures contracts ever traded.
Eventually, rice brokerage became the foundation of Osaka’s prosperity. In the mid-1750s Munehisa Homma used his family’s wealth to trade rice futures on Osaka’s Rice Exchange. Homma kept records of weather conditions, learned about the psychology of investors (going back to the time when the rice exchange was in Yodoya’s Yard), and set up his own communications system.
During this period, he also authored a couple of books about the markets. His trading principles, as applied to the rice markets, evolved into the candlestick terminology currently used in Japan.
WHAT ARE CANDLE CHARTS?
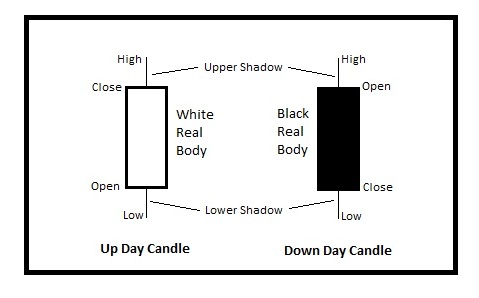
Candlestick charts are constructed using the same data as traditional Western bar charts – high, open, low, close (HOLC). The rectangular area between the open and the close is called the real body. When the real body is filled it means the session close was lower than the open. If it the real body is empty, it is the opposite – the session close was higher than the open.
Shadows are the thin lines above and below the real body which represent the session’s price extremes. The peak of the upper shadow is the high of the session whereas the bottom of the lower shadow is the low of the session.
VISUAL INFORMATION
By looking at the height and the color of the real body we get an immediate visual clue of whether the bulls or the bears are in control. Thus, candlesticks are more visually stimulating and are quicker to decipher than bar charts.
Before I go any further, it is important to note that candlestick analysis cannot be used as a stand-alone indicator for trend reversal/continuation. We must analyze support/resistance, volume patterns and other indicators in conjunction with the signals that are given to us using candlesticks.
TYPES OF CANDLESTICKS
Candlestick patterns are broken down into two main categories – reversal (the majority of candles signal patterns) and continuation. Reversal patterns are those patterns that signal a potential shift to occur in market psychology thus resulting a change in the trend. The word “reversal” in this scenario does not mean that the current trend will end abruptly and head the opposite direction.
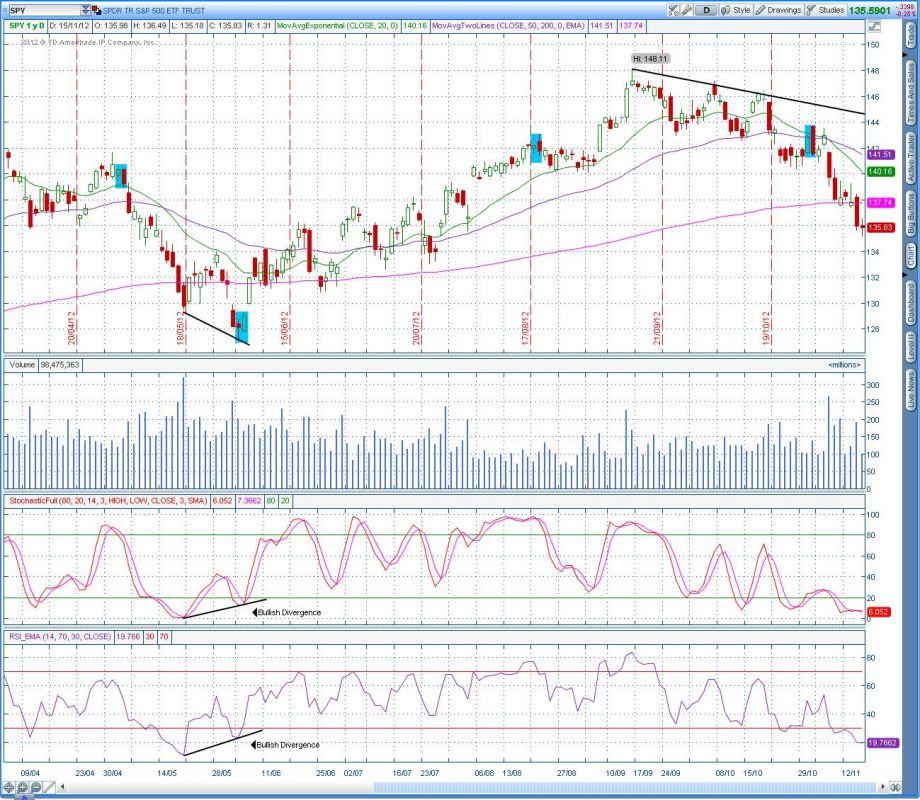
There are three directions prices can move – up, down and sideways. It simply implies that the prior trend is likely to change, but not necessarily reverse. An example and one of the most common reversal patterns is the bullish/bearish engulfing pattern. The bullish pattern is comprised of large white real body that engulfs a small black real body in a downtrend. The opposite is true when selling pressure overwhelms the buyers – a large black real body engulfing a small white real body in an uptrend. The S&P 500 (SPY) chart below shows several (bullish and bearish) recent examples of this pattern.
Continuation patterns are those patterns that indicate the previous trend will stay intact and, as the term implies, continue. Many of these patterns are a ‘timeout’ or a period of rest before the market resumes its prior trend, which is important in a healthy and sustainable trend. Some examples of candlestick continuation patterns are the rising/falling window (synonymous with the western “gap”), and the rising/falling three methods.
THE TIP OF THE ICEBERG
Candlestick analysis is a visual exercise. The more time you allocate to searching and familiarizing yourself with the patterns, the easier it will be for you to recognize them as they will become more familiar to the eye.
The patterns discussed above are just the tip of the iceberg in candlestick analysis. If this article peaked your interest and you would like to get a more comprehensive understanding of candlestick patterns and how/when to use them, make sure to get your hands on Steve Nison’s book – Japanese Candlestick Charting Techniques or check out our Japanese Candlestick Charts Tutorial.
= = =

