

Markets move in three directions: up, down, or sideways.
Sounds pretty simple, right? Then why is it so difficult to be on the right side of the market? Market direction is one of the most important factors to consider when entering the market, and a factor that is often overlooked when blindly trading a strategy. Can chart reading improve your strategy’s performance? I believe so, and in this article I’ll introduce one of my favorite indicators and how this indicator can be used with any strategy to help put you on the right side of the market.
Before we begin, it’s important to understand the type of strategy that you are trading. There are thousands of strategies and ways to trade the market, but it always comes down to two fundamental methods: trend-following and trend-fading.
Trend-Following – Strategies developed to identify and enter a market that is trending. The goal of a trend-following strategy is to trade with the trend (buy highs and sell higher, sell lows and buy lower).
Trend-Fading – Strategies developed to identify and enter a market that is moving sideways. The goal of a trend-fading strategy is to trade against the trend (sell highs and buy lower, buy lows and sell higher).
Knowing that strategies fall into the two categories above, it’s important to use chart reading techniques to ensure that you are trading a strategy in the right market environment. If you are using a trend-fading strategy, do you know how to avoid getting caught in a trending market? If you are using trend-following strategies, do you know how to spot markets that are trending and more importantly, when a trend might be coming to an end? It all comes down to chart reading and in my experience Bollinger Bands are the easiest indicator for understanding market direction.
THE BASICS
If you’re new to Bollinger Bands, the indicator consists of three bands: The Upper Bollinger Band, the Moving Average, and the Lower Bollinger Band. The standard setting for the moving average is 18 or 20, but I adjust this setting to 12 for day trading. Standard deviations of the moving average are used in order to plot the upper and lower band. The standard setting is 2 and this is the setting I use for my trading.
CHART SIGNALS
So in a nutshell, this is how I use Bollinger Bands to read the market:
UPTREND = If price is tagging the Upper Bollinger Band and the Upper Bollinger Band is clearly pointing up.
DOWNTREND = If price is tagging the Lower Bollinger Band and the Lower Bollinger Band is clearly pointing down.
SIDEWAYS = If both the Upper and Lower Bollinger Bands are both flat.
SOME EXAMPLES
To understand exactly what I’m looking for, let’s look at a few charts. I’m charting a 20 tick range bar of Crude Oil with the Bollinger Band settings above. Since the moving average is important for plotting the upper and lower band, but not used for chart reading, I’ve removed it from my charts.
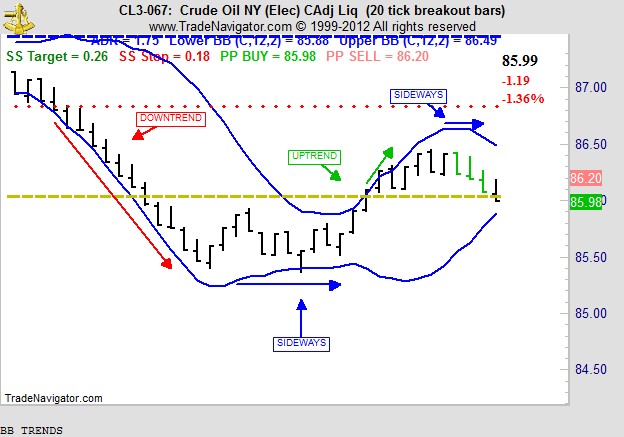
In the chart above you’ll see trends identified when price is clearly tagging the Lower Bollinger Band (downtrend), or the Upper Bollinger Band (Uptrend). The blue arrows show sideways conditions. Traders should consider using trend-following strategies when Bollinger Bands are pointing to the possibility of a trend, and trend-fading strategies when Bollinger Bands are indicating that the market is moving sideways.
A NEW TWIST
If you’ve worked with Bollinger Bands before, you might be surprised to hear that they can be used to identify trends. Since Bollinger Bands with a standard deviation of 2 contain approximately 95% of all price points, it’s easy to assume that Bollinger Bands should just be used with trend-fading strategies. In fact, this is how many traders first learn how to use Bollinger Bands (sell at the Upper Bollinger Band, buy at the Lower Bollinger Band). As you can see Bollinger Bands are much more versatile, and although bands can be used to identify relative highs and lows, simply buying the lower band and selling the higher band is not a good way to trade unless chart reading is used to identify sideways conditions.
In addition to identifying ideal conditions for entering the market, Bollinger Bands can help you if you are in a trade and market conditions are changing.
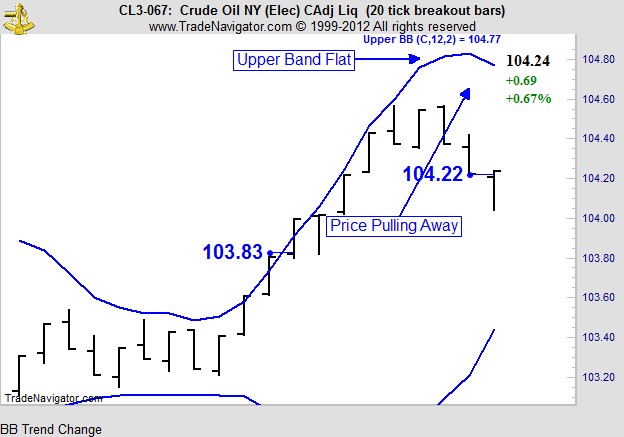
In the chart above, we see a nice uptrend. After a nice sideways range, we see price pushing higher and tagging the Upper Bollinger Band. Let’s assume we had a long entry at 103.83. As price continues to push higher, tagging the Upper Bollinger Band, the trend continues. On the 5th bar after our entry we see a bar closing lower. This would be the first concern the trend could be weakening, but with the Upper Bollinger Band clearly pointing up, there’s no reason to panic. However, after the next bar closes higher, price is starting to pull away from the Upper Bollinger Band. Two bars later the Upper Bollinger Band is flat, a sign that the trend is over.
Let’s now look at the opposite scenario in a downtrend…
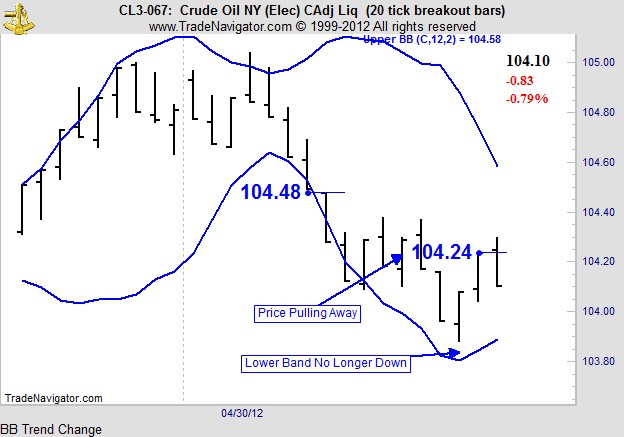
In the example above, let’s assume that we entered the market short at 104.48, when price was clearly tagging the lower Bollinger Band. The next two bars close lower and we have a nice downtrend. Looking at the 4th, 5th, and 6th bars, price has pulled away from the lower Bollinger Band (a sign that the trend might be weakening), but the lower Bollinger Band continues to point down.
If we are concerned about the trend continuing, we could move our stop loss to breakeven when price starts to pull away from the lower Bollinger Band. In this example, price continues lower for the next few bars. At the completion of the 8th bar of the trend, the lower Bollinger Band is flattening out. If we weren’t convinced that the lower Bollinger Band was sideways we could wait one more bar. However, we definitely want to close the trade at the completion of the 9th bar (104.24 close). Why? At this point the band is not only sideways, but actually pointing up, a clear sign that the trend is over.
THE TAKEAWAY
Bollinger Bands are a great tool for reading market conditions and for understanding whether the market is likely to move up, down, or sideways. Try combining Bollinger Bands with your favorite strategies or indicators to see if they help you with reading market direction and your trading.
#####
Visit our daily Markets on the Move section for specific trading ideas.

