

With Christmas being on Tuesday we have a shortened trading week, I hope you all have a Merry Christmas and get the opportunity to spend time with friends and family.
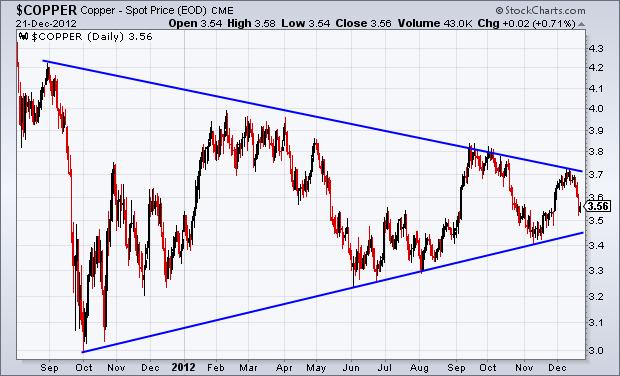
Turning our focus to the commodity market, specifically copper we can see an interesting setup being created. For the last year copper has created a large symmetrical triangle, which is often viewed as a continuation pattern. What makes the pattern that’s taking place in copper interesting is it’s not really being formed at the top of a trend or a bottom.
Taking a step back we can see copper (like equities) have been in a solid uptrend since 2009. When a symmetrical triangle is formed in an uptrend, traders will look for the bias to be on the upside when price breaks, and the opposite is true for a downtrend. However, with copper’s price action, the top of the trend is not incorporated into the pattern, making it technically a consolidation of a very small downtrend, with lower highs beginning in early 2011. So depending on how you determine the larger overall trend, the bias could be either up or down.
We can look at the futures market to try and get an idea of how the ‘smart money’ is position for a possible trend line break. Over the last few weeks we’ve seen commercial traders aggressively sell futures contracts in copper, taking their overall net position short. Looking at previous examples of this happening, copper has experienced some weakness but not necessarily drastic moves to the downside.
Going forward we can be looking for a trend line break, either through resistance or support. Where the break occurs can hold some importance, the closer we get to the triangle’s apex (where the two trend lines converge) the break loses more and more steam, so to speak.
Once the break occurs we can then turn back to the Commitment of Traders data and see how the overall market is position. When a trend line break does occur it’s often followed by a re-test of the very support or resistance it broke. Price actions ability to maintain above or below the respective trend line can give us an indication of whether the break will hold or not.
Disclaimer: The information contained in this article should not be construed as investment advice, research, or an offer to buy or sell securities. Everything written here is meant for educational and entertainment purposes only. I or my affiliates may hold positions in securities mentioned.
= = =

