

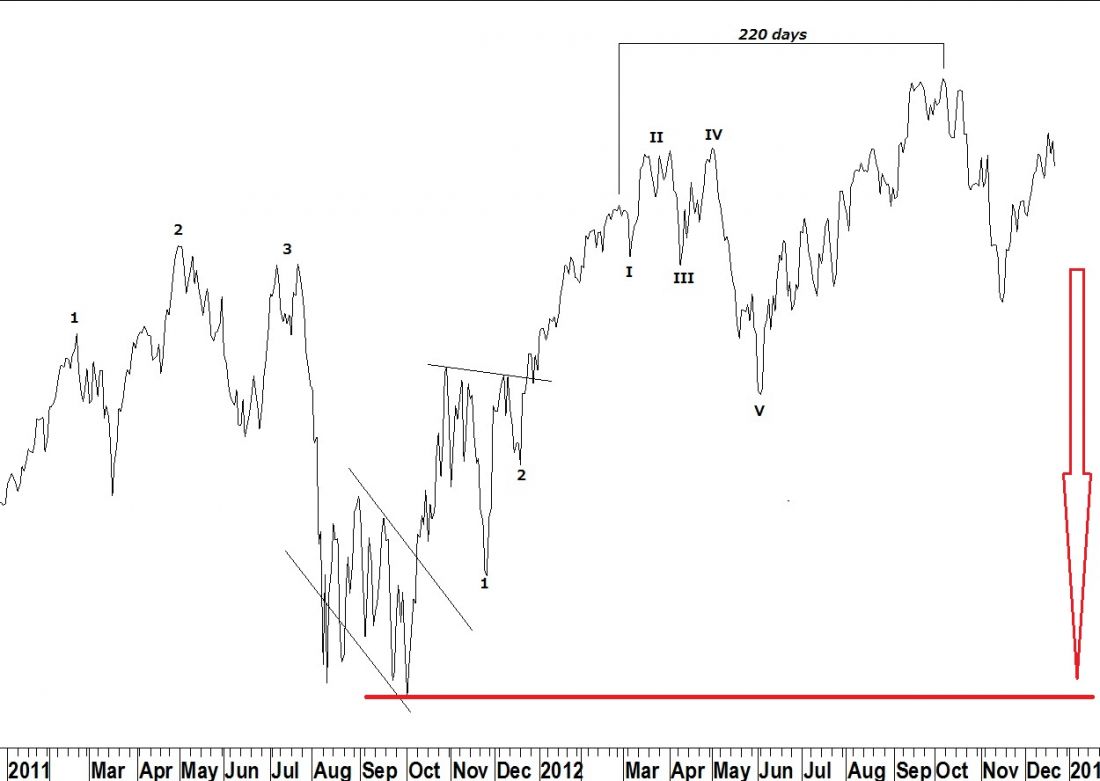
The work of George Lindsay is primarily concerned with time as opposed to price. However, when a Three Peaks and Domed House pattern is apparent Lindsay did have two methods of forecasting price. The first (and simplest) calls for a bear market, following the top of the pattern, to return to the bottom of the pattern. This is a minimum forecast as price may exceed this level to the downside. Although Lindsay never explicitly wrote that the “bottom of the pattern” was the bottom of the base, his examples make clear that was his intention. In our current situation, the “bottom” was the October 2011 low near 10,655 in the Dow Industrials index. Lindsay always used the Dow index for his models and cautioned against using broader indices such as the S&P 500 or New York Composite index.
His other approach to forecasting the low of a bear market, following the Three Peaks/Domed House pattern, is called the Tri-Day Method. He explained this approach in a series of five supplements to his newsletter from May to September, 1959. The Tri-Day method gives a specific price forecast to the end of a bull market and is fully explained in my book George Lindsay and the Art of Technical Analysis.
I’ll be gone next week but on January 14, 2013 this commentary will examine a timing forecast for the end of the current bear market.
Picking Stock Market Tops: George Lindsay
Read more trading ideas in our daily Markets section.

