

I like Amazon (AMZN). I like the stock, I like the company, I like their customer service and I like their website. Their logo is even catchy. You have Amazon.com – it’s also a face, it’s winking and then you have an arrow (that also represents a smile) from a-z showing Amazon sends and delivers everything from A-Z. True innovation and I love it because I love innovation and smiles.
CHART ACTION
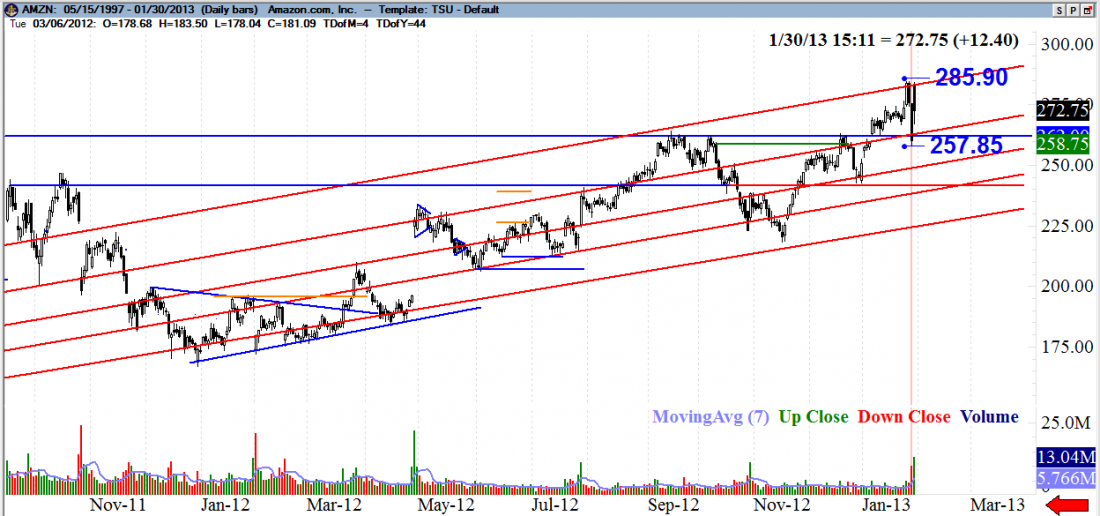
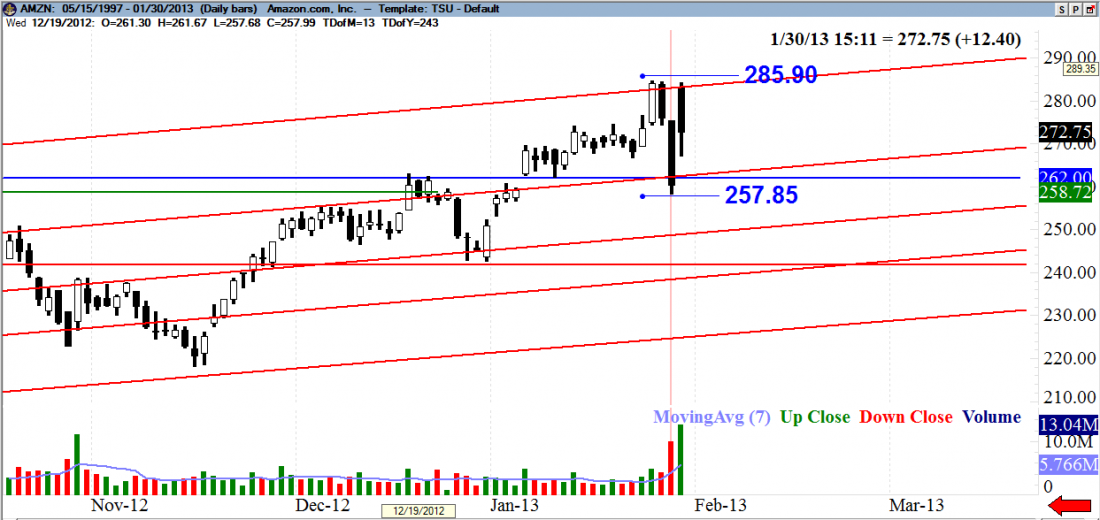
AMZN has been following some stellar trend lines since November of 2008. The angle (and I’m guessing here) is probably about 30 degrees, which is quite sustainable long term. Even with the wild and volatile ride leading into earnings, the top two trend lines were still respected. Below is a second chart of AMZN, just more zoomed in.
GAP FILLED
The gap created on the 01/07/2013 candle has been filled. On 01/07/2013 Amazon closed above it’s all time high price and traded right to a predictable target (a previous trend line) around $283.00 It’s interesting to note that same price has proven to be quite a strong resistance recently.
THE PLAY
Therefore, I have a simple bracket order in place. This set up is all about trading neutral. I truly don’t care which direction AMZN trades, or how well it did in earnings, or how many units, packages it sold. We have a strong support at $262. If we close below that and below $257.85, some bearish moves would be a probability. $285.90 is a bullish trigger. As before and in previous trades, it is a higher probability to wait for a close at an all time high. Both trades currently represent incredible risk reward ratios. AMZN could soon join the ranks of the other “high roller” stocks like MA, GOOG, and APPL.
= = =
You are probably best off not listening to the experts says Jack Schwager. Read the story here.

