

I remember vividly my handy, dandy TI-83+ calculator when I was in high school and college. It was actually a requirement for some of my math classes. I did enjoy math in school and I was quite good at it, up to a point. After the curriculum got into derivatives, calculus, logs, and sloping equations of “non real integers” I lost interest, mostly because “non real integers” do not pay the bills, unless of course you are the US government. I digress.
KEY PATTERN
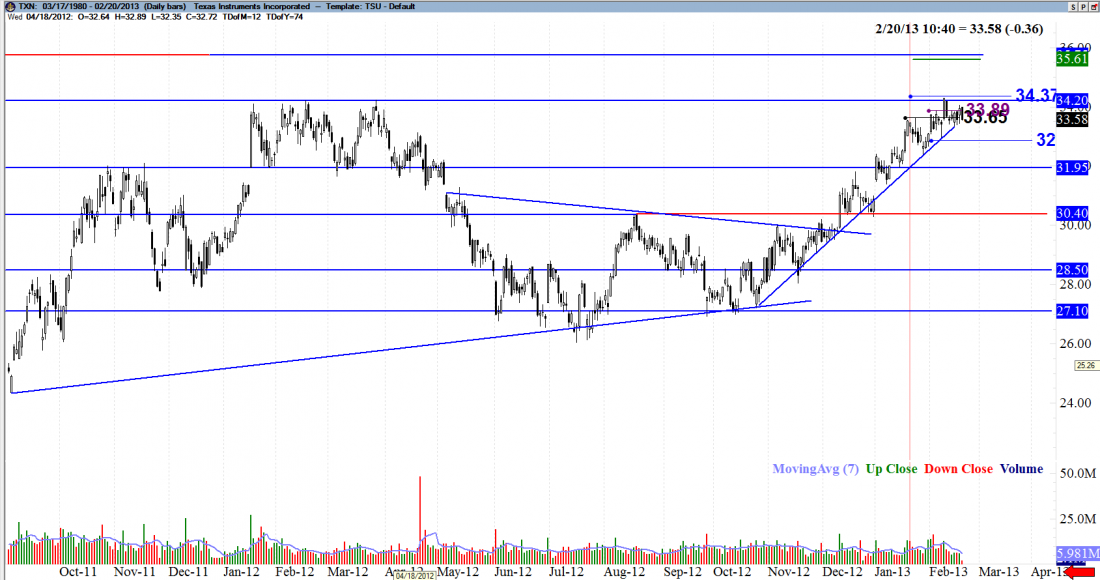
Texas Instruments is a stable company and a great stock for technical analysis because of its discipline. Back in early December, TXN broke out of a rough triangle pattern of sorts. The volume increased along with a nice size bullish confirmation candle on 12/11/2012. TXN then had a healthy bullish trend to a strong resistance at $34.00 which was an ultimate target. At this location, I do expect a sideways move for a period of time as we enter a distribution phase. My previous purple and back triggers around $33.65 were quicker, day trading triggers. The ultimate target for those day trades was the resistance around $34.20.
TIME FOR COVERED CALLS
If one owns at least 100 shares of TXN this location would be an ideal for selling some March $34 or $35 covered calls, as long as your average cost per share is less than $34. If TXN closes above $34.37 the next target would be a resistance around $35.61. Again, it’s all about being neutral in your trades. If we break our current up trend, a close below $32.87 would likely result in a pull back and a test of old resistance as new support, around $31.00, where a healthy little gap is located. Again, if you own shares of TXN, now would be a good time for you to consider purchasing protective puts as a hedge for your overall position.
= = =
Related article:

