

Amidst the backdrop of recessions in Europe and Japan and anemic economic growth in the U.S. the stock market has shown great strength in 2013. In fact, since its corrective low last November, the DJIA has vaulted some 1500 points or 18%. Add that on top of the recovery from the “financial crisis” and we have a 117% gain off the panic low in March 2009. The majority of analysts are quite exuberant; many seeing much higher levels for stocks for the rest of 2013. History says that might not be true.
The two things I want to examine in this article are the stock market’s historical long-term patterns and more recent market influences that suggest stocks could be in trouble sooner than most think.
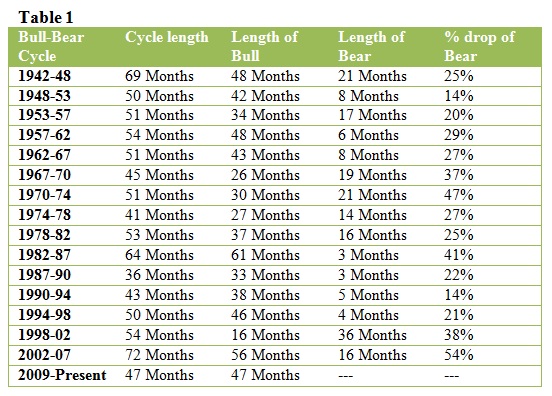
The onset of WWII came as the world was already battling to come out of the Great Depression. A historical bear market low came in 1942, which was followed by a bull market that lasted for 48-months. The bear market that followed lasted for 21 months, with the DJIA losing 25% of its value. That “cycle” measured from the low point of one bear market to low the low point of the next, lasted 69-months. Since that low, in 1949, the stock market has had 14, similar, and very recognizable cyclical patterns.
Table 1 shows the years of each bull-bear cycle, the length of the bull and bear phase, and depth of the following bear market. Also, you can see the length of each cycle; from one bear low to the next. Bull markets ranged from 16-months to 61-months. Bear markets ranged from just 3-months to as long as 38 months. The average cyclical length was around 54-months. What is very obvious is that long bull markets tended to be followed by short and sharp bear markets (1957-62 and 1982-87) and short bulls were followed by long bears (1974-78 and 1998-2002). So this historical record suggests; the current bull market, now 47 months old, is getting quite long. Therefore, it is likely that 2013 will see a bull market top, followed by a relatively short, likely sharp, bear market.
So let’s look at the recent history. Following a shallow bear-market low in 1998, the stock market roared ahead, driven by the explosion of the internet and the technology sector. Valuations in the tech stock got so high; they lifted the NASDAQ to 5000. The FED, fearing the overheating market, raised interest rates, as they do, to slow things down. The “tech bubble” popped, setting off a NASDAQ crash, with losses near 88%, and an economic contraction. Then, Fed Chairman Alan Greenspan responded, driving the fed funds down to 1%, in 2002.
Greenspan’s actions, keeping interest rates very low for a very long time, lifted the stock market to all-time highs in 2006-07. It also pumped up the real estate market, already overly inflated by extraordinarily loose lending standards and irrational government policies. This was bubble II, “Greenspan’s bubble.” See, “Greenspan’s Bubbles”, by William Fleckenstein
Once again, the Fed’s interference set up a huge problem. As interest rates rose, the massive real estate/mortgage bubble popped, and the stock market again crashed. Then Bernanke’s Fed stepped in, again driving down interest rates. Since 2009, we have seen bailouts, ZIRP (Zero interest rate policy) and four rounds of QE (quantitative easing). While the economy did stabilize, economic growth and job creation has been very slow.
The actions of Bernanke’s Fed have created $3 trillion, which the Treasury has taken on their balance sheet. During this period of poor economic growth, there has been one asset class with exploding growth; ETFs. Since the onset of these Feds actions, beginning in ’08, the number of ETFs has rocketed from around 1700 to nearly 4000. Assets in ETFs, in the U.S. have exploded to over $1.6 trillion. With the economy stabile, gold and commodity prices flat; investors are looking for diversification and return. So money is pouring out if money-market funds into equity ETFs, which, in turn, are increasing their equity holdings and driving the stock market upward. This is “Bernanke’s ETF Bubble.”
So now, with the stock market nearing all-time highs, we have the third bubble in just 14 years.
As illustrated in the first part of this article, this bull market is historically long, with a likelihood of a relatively short bear market appearing in the near future. With the huge number of funds having moved into ETFs, once the Fed acts to withdraw stimulus and the market peaks, investors will all be trying to exit out of the same doorway. This could make for a very sharp market decline.
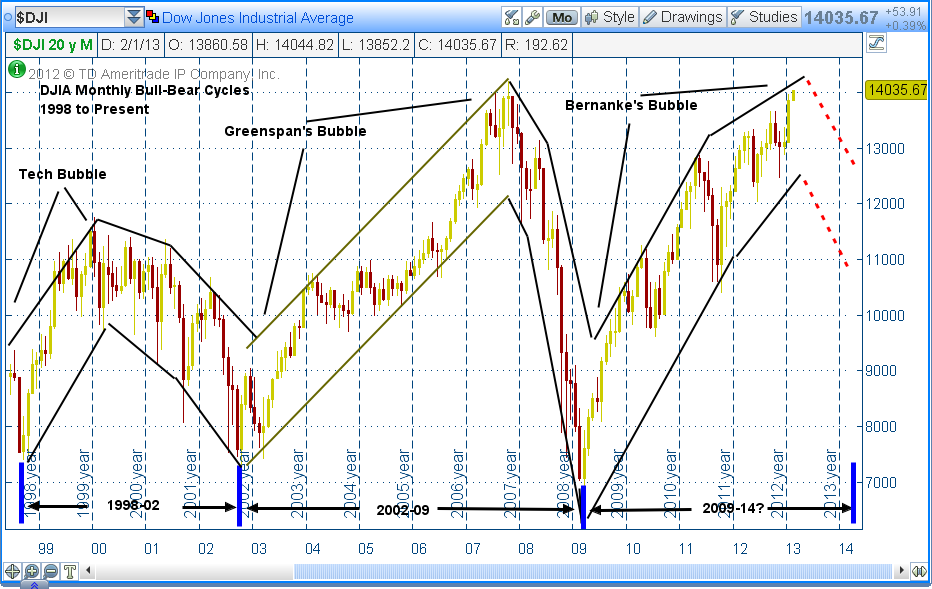
As the table above shows, the average bear market drops over 30%. And in all of this history, a bear market has never failed to appear following a bull. The chart below graphically shows what the past three bull-bear cycles have looked like, with a projection of the coming bear market.
BOTTOM LINE
So, while investors are pouring money into ETFs and driving stock markets upward, this could be a very good time to avoid the rush and begin your exit.
Chart 1, DJIA Monthly Bull-Bear Cycles
= = =

