

It is well-known that equities are an inflation-hedge. Financial advisors have been telling this to their clients for decades. But inflation, or rather expected inflation, can tell us something about the equity market.
Expectations of price increases (inflation) are a sign of a potentially stronger demand growth and higher margins, which is a positive for stocks. There is a tendency for equity prices to rise as inflation expectations heat up, and to decline as inflation expectations cool off.
In the chart below the S&P 500 is the red line and the blue line is a measure of inflation expectations. It is derived by subtracting the rate of the 10-year constant maturity TIP from the 10-year constant maturity US Treasury note. The interest rate on US Treasury notes provides both a real return plus an inflation premium. TIPS pay only a real return. By subtracting the latter from the former (blue line in chart) we derive the expected inflation rate.
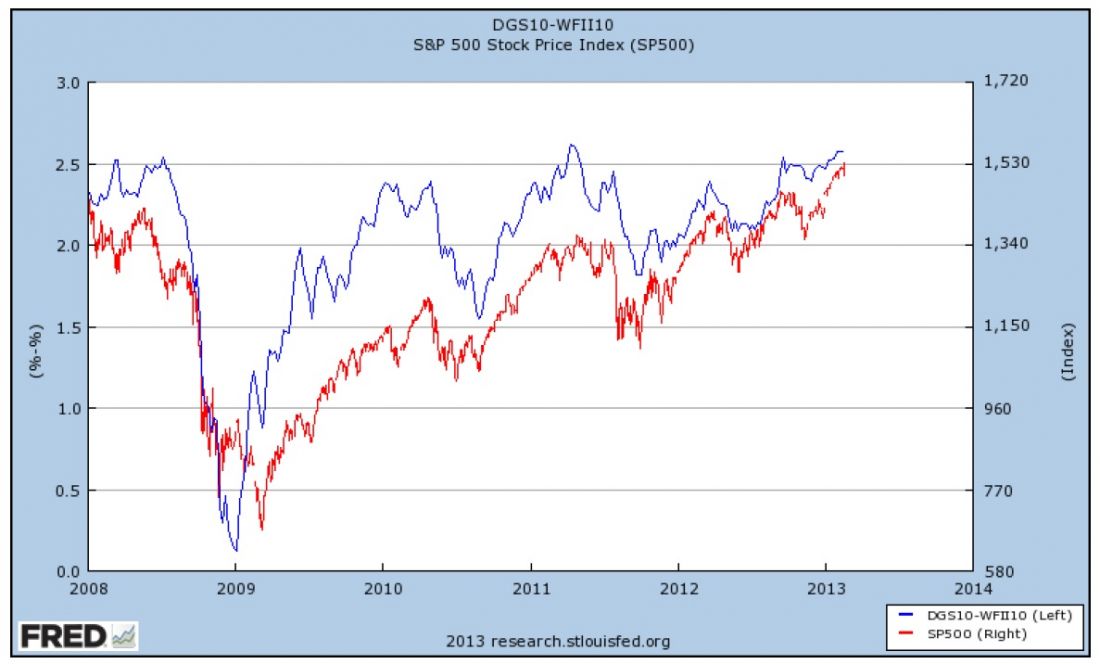
Note how well correlated the two lines are reflecting the expectations noted above in paragraph two. Now take a closer look. Since the low in late 2011 the S&P 500 has been making new highs while inflation expectations, while rising, have remained anchored making much less progress. This non-confirmation should be troubling to equity investors and match my call for a top in the bull market derived from my work with the models of George Lindsay.
= = =
Read more stories here:
Bernanke’s Bubble: Setting Up The Next Bear Market

