

Comparing the S&P 500 chart over the last five years since the US markets bottomed in March 2009, and during the previous cycle from 2003 to the peak in the fall of 2007, one might infer that we are at year five of this market cycle; thus it would seem that a bear market should soon follow.
It is not hard to imagine that a bear market is coming if we compare how far US markets have risen since bottoming in 2009 with ongoing financial concerns of lackluster consumer demand, rising oil prices and the current hot button, sequestration.
TLT and the Domino Effect of the Global Banking Crisis
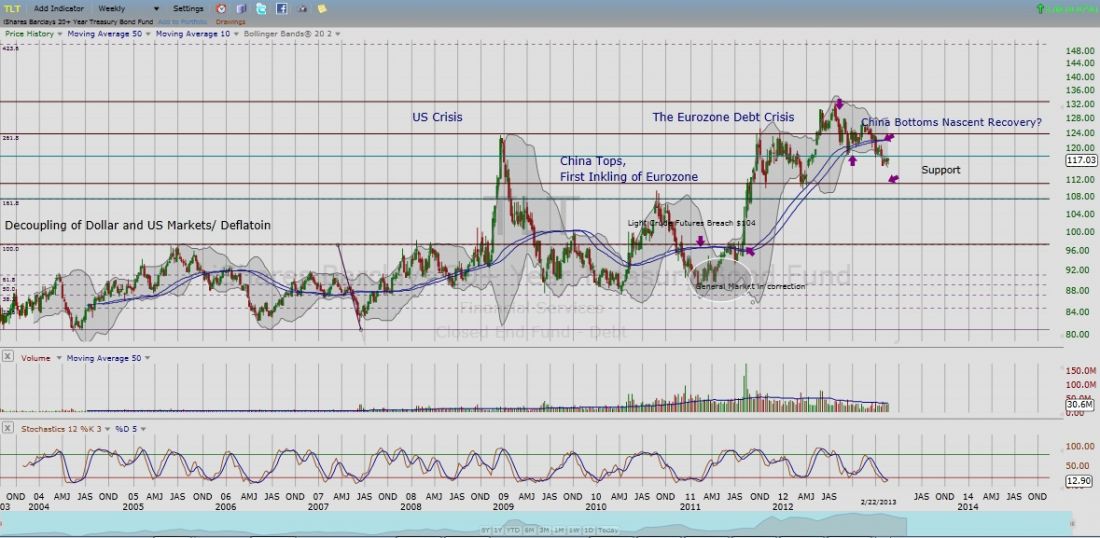
The five-year global banking crisis escapes detection when viewed through the lens of S&P500. However, the TLT (20+ year Treasury) considered risk-free and sensitive the to rise/fall of inflation shows this five-year crisis with picture perfect clarity. The TLT provides a visual of the domino effect of the global banking crisis that began with the US and ended in Europe. The bull market of the first half of the last decade showed a comparatively stable bond market. It also coincided with the decoupling of the bond market and the equities markets. Such that, since the decoupling, the TLT has a negative correlation to the equities market. Looking at the S&P500 alone, the dot.com bubble of 2000 was replaced by the financial bubble of 2008. However, following the trail of the TLT, what we see is the U.S. banking crisis culminating in 2008 was soon followed by the first signs of the Eurozone debt crisis as early as the fall of 2009. In the spring of 2010, Chinese markets topped and the BP oil spill served as a catalyst for the summer correction. That summer, oil once again found a bottom and the markets renewed their optimism for continued growth. However, by the summer of 2011, the Eurozone crisis began to build momentum until finally reaching a crescendo in the summer of 2012.
Near Term View of the TLT
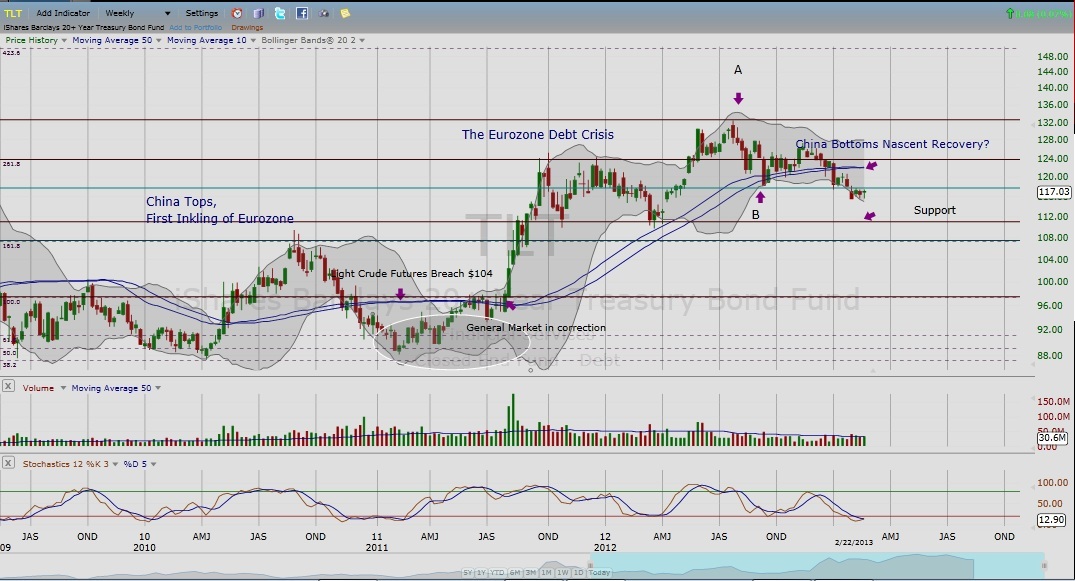
The TLT peaked the summer of 2012, and U.S. markets bottomed and a new uptrend resumed. Finally at the beginning of the New Year, and for the first time since summer 2011, the TLT fell below its 50 weekly moving avearge (wma), an important technical support that signals a return of long term inflation – a positive catalyst for the equities market. With a closer inspection of the TLT since the fall of 2012, we see it testing the 10/50 wma supports mid-September at B. This coincides with oil peaking and the dollar bottoming, warning the markets once again of stalling global growth. Given oil’s current levels, we expected on our personal blog then that the correction in the fall would initiate a bear market. That is not what happened. As shown above, TLT would peak mid-November, coinciding with US markets bottoming and a follow-thru by late November. In other markets, China seemed to have bottomed, along with groups normally seen breaking out at the beginning of a new cycle, e.g. finance, semi-conductors and some NASDAQ sleeping giants like YHOO and HPQ. The equity uptrend gained momentum as the TLT broke down thru its 10/50 wma at the New Year.
Where are we now?
Do you remember the movie Cool Hand Luke with Paul Newman and the scene where the main character refuses to stay down when he is clearly out muscled? This is a common behavior among once-favored stocks. They simply refuse to stay down, and what you get is a stock behaving like AAPL, whose technical chart has been weak since the fall, and yet continues to try to and get up again rather than admit defeat. We can expect the TLT to behave in similar fashion, especially with the challenges that continue to plague the economy. In addition, elevated oil levels and the prospect of sequestration are sure to put more pressure on consumers and industry.
Despite the eventual and expected market correction when the TLT fights to “get back up,” the TLT shows classic long term technical weakness. This counters the initial interpretation that we are at year five of the market cycle. From the TLT’s perspective, we are at year one; although, the characteristics of a new cycle are less stable than they were when both oil and the markets bottomed in 2009. It would seem that, after the correction, the markets are due to rise again with the return of inflation.
= = =

