

The resiliency of the equities market has been a thing to behold over several months now. The ability for the bulls to step in at any sign of weakness has kept the cubby bears at bay for some time. There is no doubt that those who continue to short in the hole have added fuel to the fire. Like anyone that has touched a hot stove top, it doesn’t take more than one or two times to feel so burned that they won’t try it again. We are starting to see signs of this in the market. Long term bears are turning bullish. They likely have stepped in too early and as a result have suffered repeated losses by risking too much at the wrong time.
If you are going to go against the trend, and especially if you’re looking for a major top, you must realize that it is a process. In my last article, I laid out some of the exuberant sentiment in the market. My fundamental thesis is well known.
Now let me explain the line of demarcation.
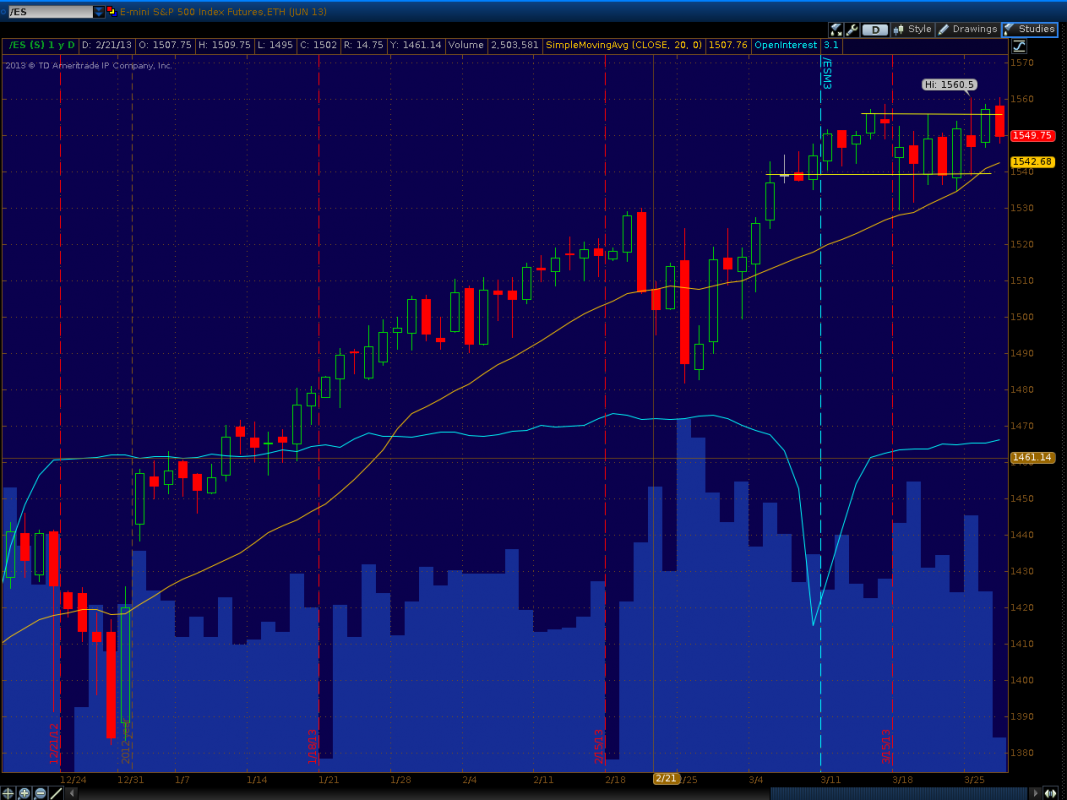
Every moment in the market is unique; this time is no different. The way that the past couple of weeks have played out by forming a new range, between approximately 1542-1556 in the S&P futures ($ES_F). As soon as we try to break out a couple points in either direction, the gravity of the range has pulled price back into the box.
This was made evident again yesterday as futures closed at highs, made an overnight high at 1560, but quickly was met with resistance. Likewise on Monday, the market made a low in the 1540s, but that midday low was met with aggressive buyers in the cash market and large buyers in the pit, as reported by @TradersAudio. But what’s really going on with this price action? 10-20 point moves in both directions have formed a pattern of alternating green and red candles. During this time, anyone stubborn in one direction has been met with disappointment. The market is doing its best to seriously test prior support and resistance, and is doing a fantastic job of repeatedly fooling those who only buy breakouts or only short weakness.
What’s the key takeaway from all of this price action?
There is a pattern that has developed underneath the surface. A technical indicator that has served as a basis for the bulls is the 20 day moving average. Each time the bears have taken the market at or just below this line of demarcation, the bulls have stepped in hard to keep momentum to the upside. During the past two weeks, however, this line has been tested 6 times. The bulls are running out of steam. The breaking point for this trend may very well be a close that occurs beneath the 20Day. I suspect it may be re-tested from below, but failure to recover the 20 day after a 7th test of this key line will trigger the start of a much larger pullback to 1520, followed by 1500 and work through a lot of stubborn late-turned bulls by exploring the high 1480s.
The ball is still in the bull’s court, but the battle of 1549.50-1548 is important to watch in the next few trading periods.
I don’t think a 7th test of the line of demarcation will be met by strong buyers. Focus on risk.
= = =

