

I am a big proponent of keeping things as simple as possible when it comes to trading. For example, I like to track a fixed basket of stocks for setups instead of chasing the “hot” stock of the day and I think that the fewer monitors you use to trade the better. I know that there are successful “quant” types out there who will argue with me, protesting that you should use everything, plus the kitchen sink, in the trading tool bag in your quest for alpha. But those traders are the exception to the rule and in my experience; the average retail trader should stick to the “less is more” philosophy.
With that concept in mind, I want to talk about chart time frames and how you can use them in most simple and effective way.
The spectrum of time frames you call pull up on most charting programs run from tick charts, which track every movement in a stock, to monthly charts, which will show you the macro picture. And somewhere in between are the time frames that are most applicable to effective trading. For me that comes down to the 5-min chart and the 15-min chart.
Charts below the 5-min time frame are ultra sensitive to movement but you get too much noise and are a more apt to get “whipsawed” out of a position prematurely. Charts above the 15-min time frame, especially the 30-min and 60-min ones, can be useful for finding intermediate term trends but are not sensitive enough to find optimal entry points. With a combination of the 5-min and 15-min you should be able to find entry and exit spots for both day trading and swing trading.
I always have both chart timeframes up right next to each other as they give different but complimentary views. Take for example this setup in V (Visa) from earlier this week.
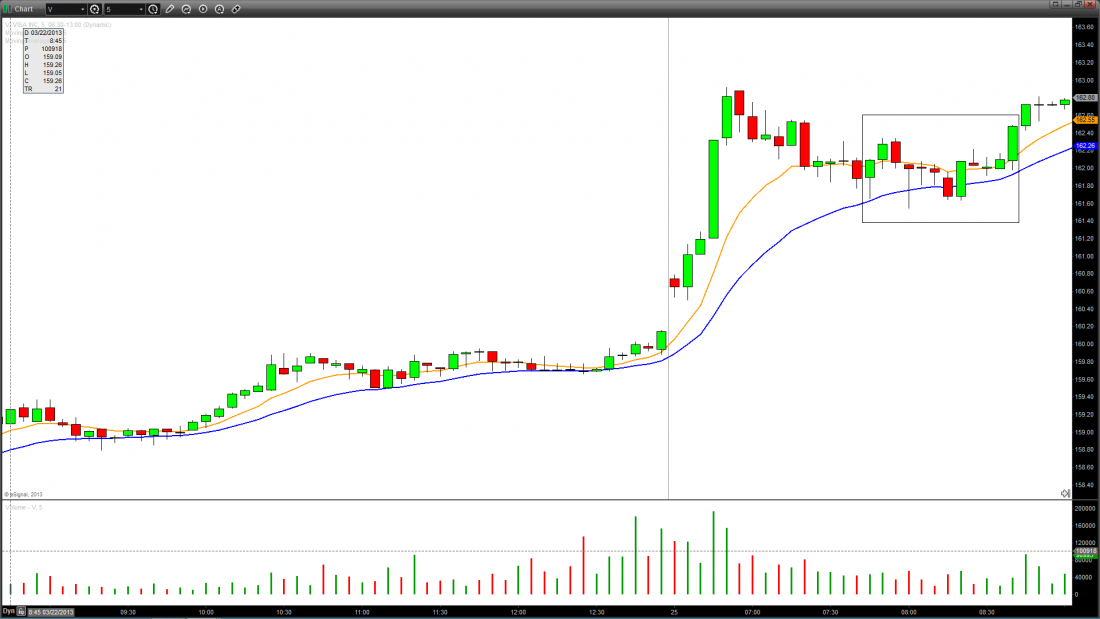
V gaps up and pulls back to the 20EMA, but the move is choppy with no obvious entry signal on the 5-min chart.
Now take a look at V on a 15-min chart.
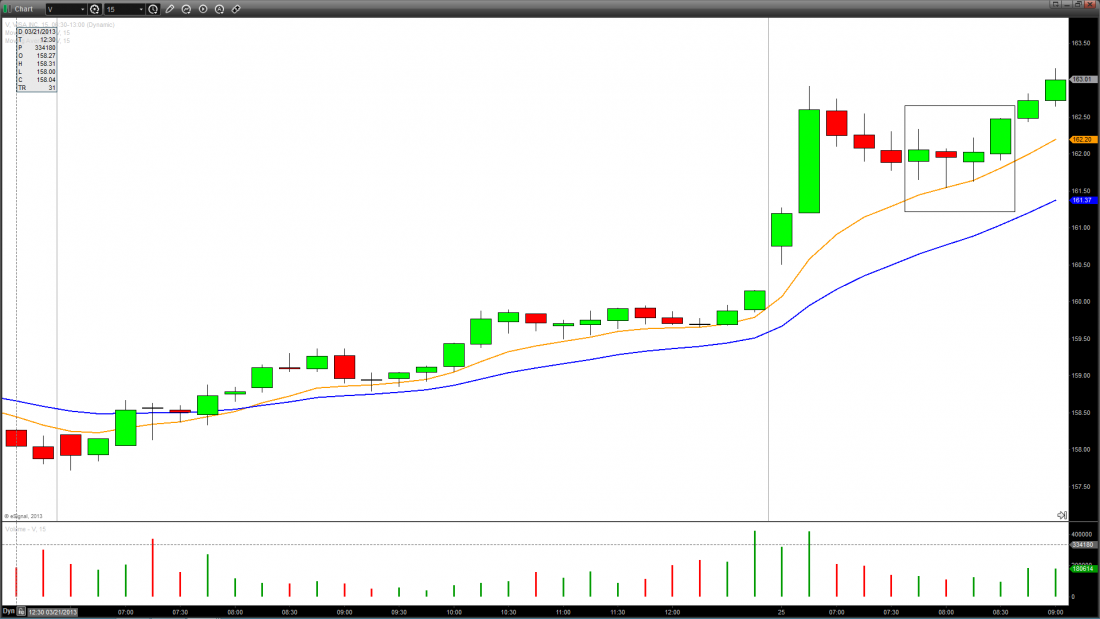
On this chart you can see the same area as indicated on the 5-min chart (outlined by the box) and there is a much clearer spot to get long off of the 7th or 8th candle with a stop below the rising moving average.
Remember, when trading the markets it doesn’t matter how complex your system is, it only matters if it works, and putting the emphasis on the 5-min and 15-min charts will filter out much of the noise and keep your focus on what is important.
==

