

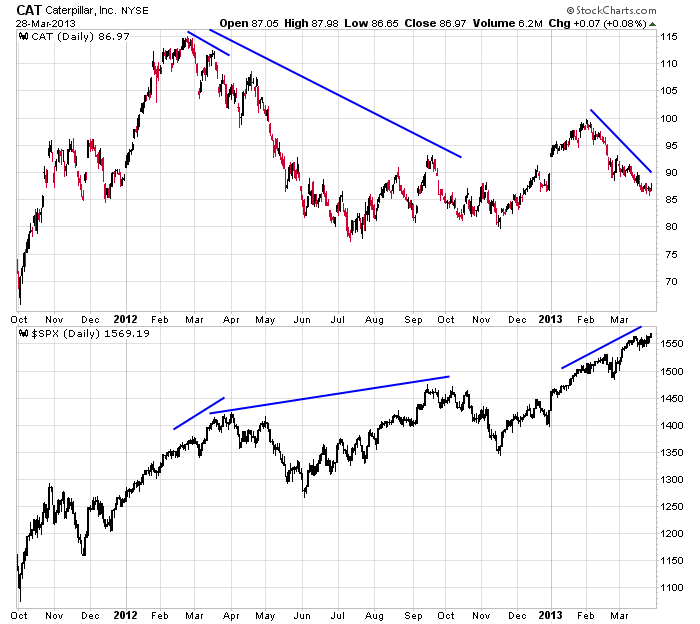
It’s hard to not be bullish nowadays. Except for the NASDAQ, every index is at or very near an all-time high. That’s pretty amazing considering everything going on in the world. But here’s a chart that throws a little cold water on the excitement. It’s Caterpillar (CAT) vs. the S&P 500. Divergences like these are commonplace, so I want to look beyond the technicals and surmise what it may mean.
In my opinion, tech stocks are not good “tells” for the economy because market share can quickly rotate from one company to the next. If Apple is struggling, who cares? Maybe consumers are buying Amazon tablets or Samsung phones. If Intel is struggling, who cares, Qualcomm is near an all-time high. Such isn’t the case in the construction machinery sector.
Construction in the US and many other countries is upwards of 10% of GDP. Whether new stuff is being built or old stuff is being repaired, it’s an unavoidable cost. But market share cannot easily rotate from one company to the next like in the tech space. In CAT’s case, the company is so big, it IS the market. In fact CAT’s market cap is bigger than all of its competition combined, so it would be impossible for any company to steel any more than a tiny bit of CAT’s business. Because of this, because CAT essentially is the market, I’m wondering what the meaning of its lagging stock is. Is construction slowing down worldwide? Does CAT hint at higher interest rates in the pipeline? I’m wondering if CAT is a proverbial canary in a coal mine. Is it hinting at something going on that isn’t yet known or isn’t yet in the charts? I don’t have the answer, but this development isn’t something I’m going to ignore.
==

